Hourly Trading System (Zeiierman)
A comprehensive hourly trading system that plots key price levels, identifies trend direction, and highlights potential entry and exit points across different timeframes.
Explore 11,183 indicators. Filter beyond the obvious.
Discover the tools that fit the way you trade.
11,183 tools to explore
A comprehensive hourly trading system that plots key price levels, identifies trend direction, and highlights potential entry and exit points across different timeframes.
A trend channel indicator that identifies support and resistance zones using pivot highs and lows, helping traders visualize market trends and potential breakout points.
A harmonic pattern detection indicator that identifies Three Drives patterns using multi-length swing detection and Fibonacci ratios to spot potential market reversals.
A trading system for identifying potential trend reversals using setup and count methods with support and resistance levels for strategic market entry and exit points.
A trading indicator that highlights previous market highs and lows, creating customizable support and resistance zones across multiple timeframes to help traders identify potential price reaction levels.
A market analysis tool that calculates probabilities of price tops and bottoms across various time periods, offering traders strategic insights into market timing and potential trend reversals.
A trading tool that tracks cumulative buy and sell volumes across different time periods, providing visual insights into market participant behavior and volume dynamics.
A comprehensive trend-following indicator using moving averages to identify bullish and bearish market trends across different timeframes with color-coded visual alerts.
An advanced market structure indicator that identifies key price breaks, market structure shifts, and potential support/resistance zones using pivot points and customizable target calculations.
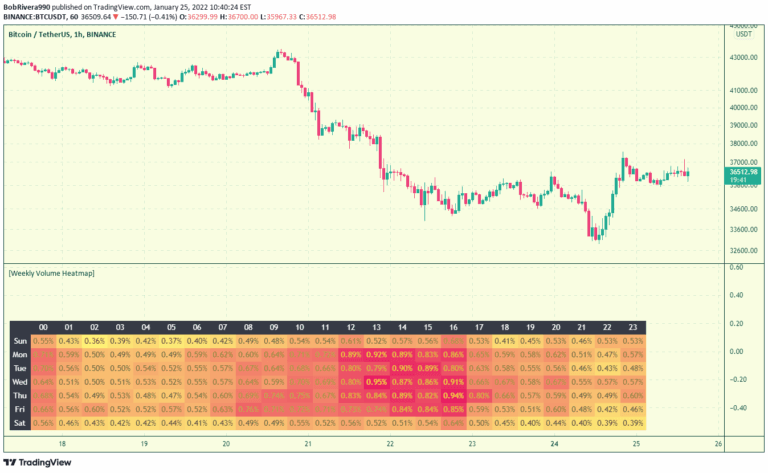
A trading tool that visualizes asset trading volume variations across different times of the week, helping traders understand market liquidity and optimal trading periods.
A polar chart tool that visualizes cryptocurrency dominance by combining traded dollar volume and volatility across multiple timeframes for easy comparative analysis.
The Exponentially Weighted Moving Average (EWMA) is a dynamic technical analysis tool that provides insights into market trends by giving more weight to recent price data.
Likes, views, and comments are historical TradingView snapshots. They describe attention, not trading performance.