Price Action Smart Money Concepts [BigBeluga]
Advanced toolkit analyzing market structure and institutional investor behavior through interconnected indicators that reveal supply, demand, and potential price movement patterns.
Explore 11,183 indicators. Filter beyond the obvious.
Discover the tools that fit the way you trade.
11,183 tools to explore
Advanced toolkit analyzing market structure and institutional investor behavior through interconnected indicators that reveal supply, demand, and potential price movement patterns.
Liquidity Concepts indicator identifies potential stop-loss zones and market structure using pivot points to help traders detect liquidity grabs and stop-loss hunts.
A trading strategy analyzing Smart Money market manipulation by identifying order blocks and pivots to help traders understand and align with institutional trading patterns.
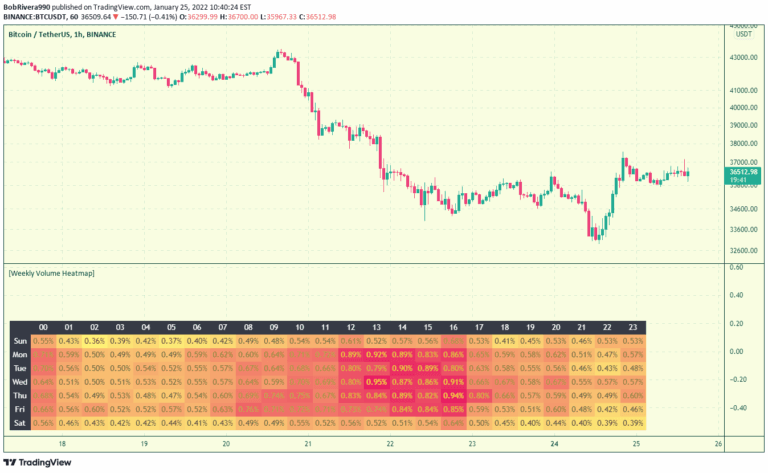
A trading tool that visualizes asset trading volume variations across different times of the week, helping traders understand market liquidity and optimal trading periods.
A multi-functional trading indicator that visualizes high timeframe liquidity levels, identifies market structure breaks, and highlights price displacements for advanced trading strategies.
A trading strategy focusing on specific market sessions and high-activity 'kill zones' to identify potential trading opportunities based on price movements and volume.
A trading indicator that identifies price ranges by analyzing candle patterns and market equilibrium zones, helping traders spot potential trading opportunities during calm market conditions.
A trading signal that identifies liquidity raids and stop-hunt moments in price action, highlighting rapid price movements and potential trend reversals through wick and candle analysis.
A custom forex trading indicator that identifies high-probability entry points by hunting liquidity zones during London and US trading sessions using candle momentum and optional trend filtering.
A volume profile indicator that tracks market sessions, detects sweep signals at key price levels, and identifies potential trend reversals using institutional trading patterns.
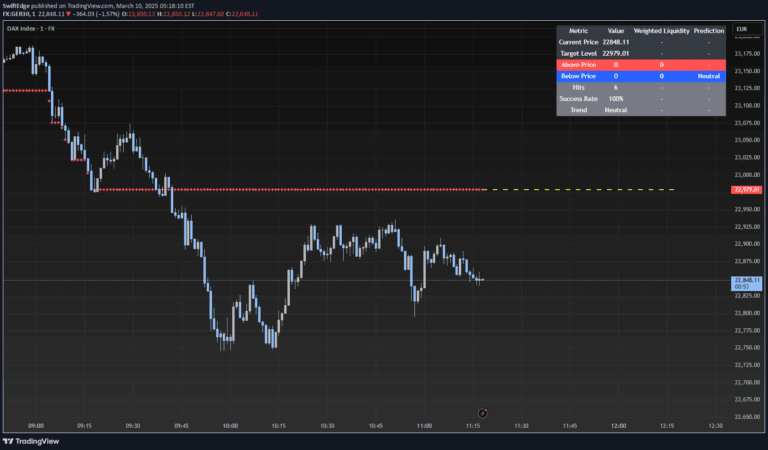
A dynamic liquidity hunting dashboard that identifies potential market movement targets by analyzing swing points, volume, and trend using technical analysis tools.
A liquidity zone indicator that tracks Highest High and Lowest Low to identify potential market order accumulation points and institutional price targeting strategies.
Likes, views, and comments are historical TradingView snapshots. They describe attention, not trading performance.