
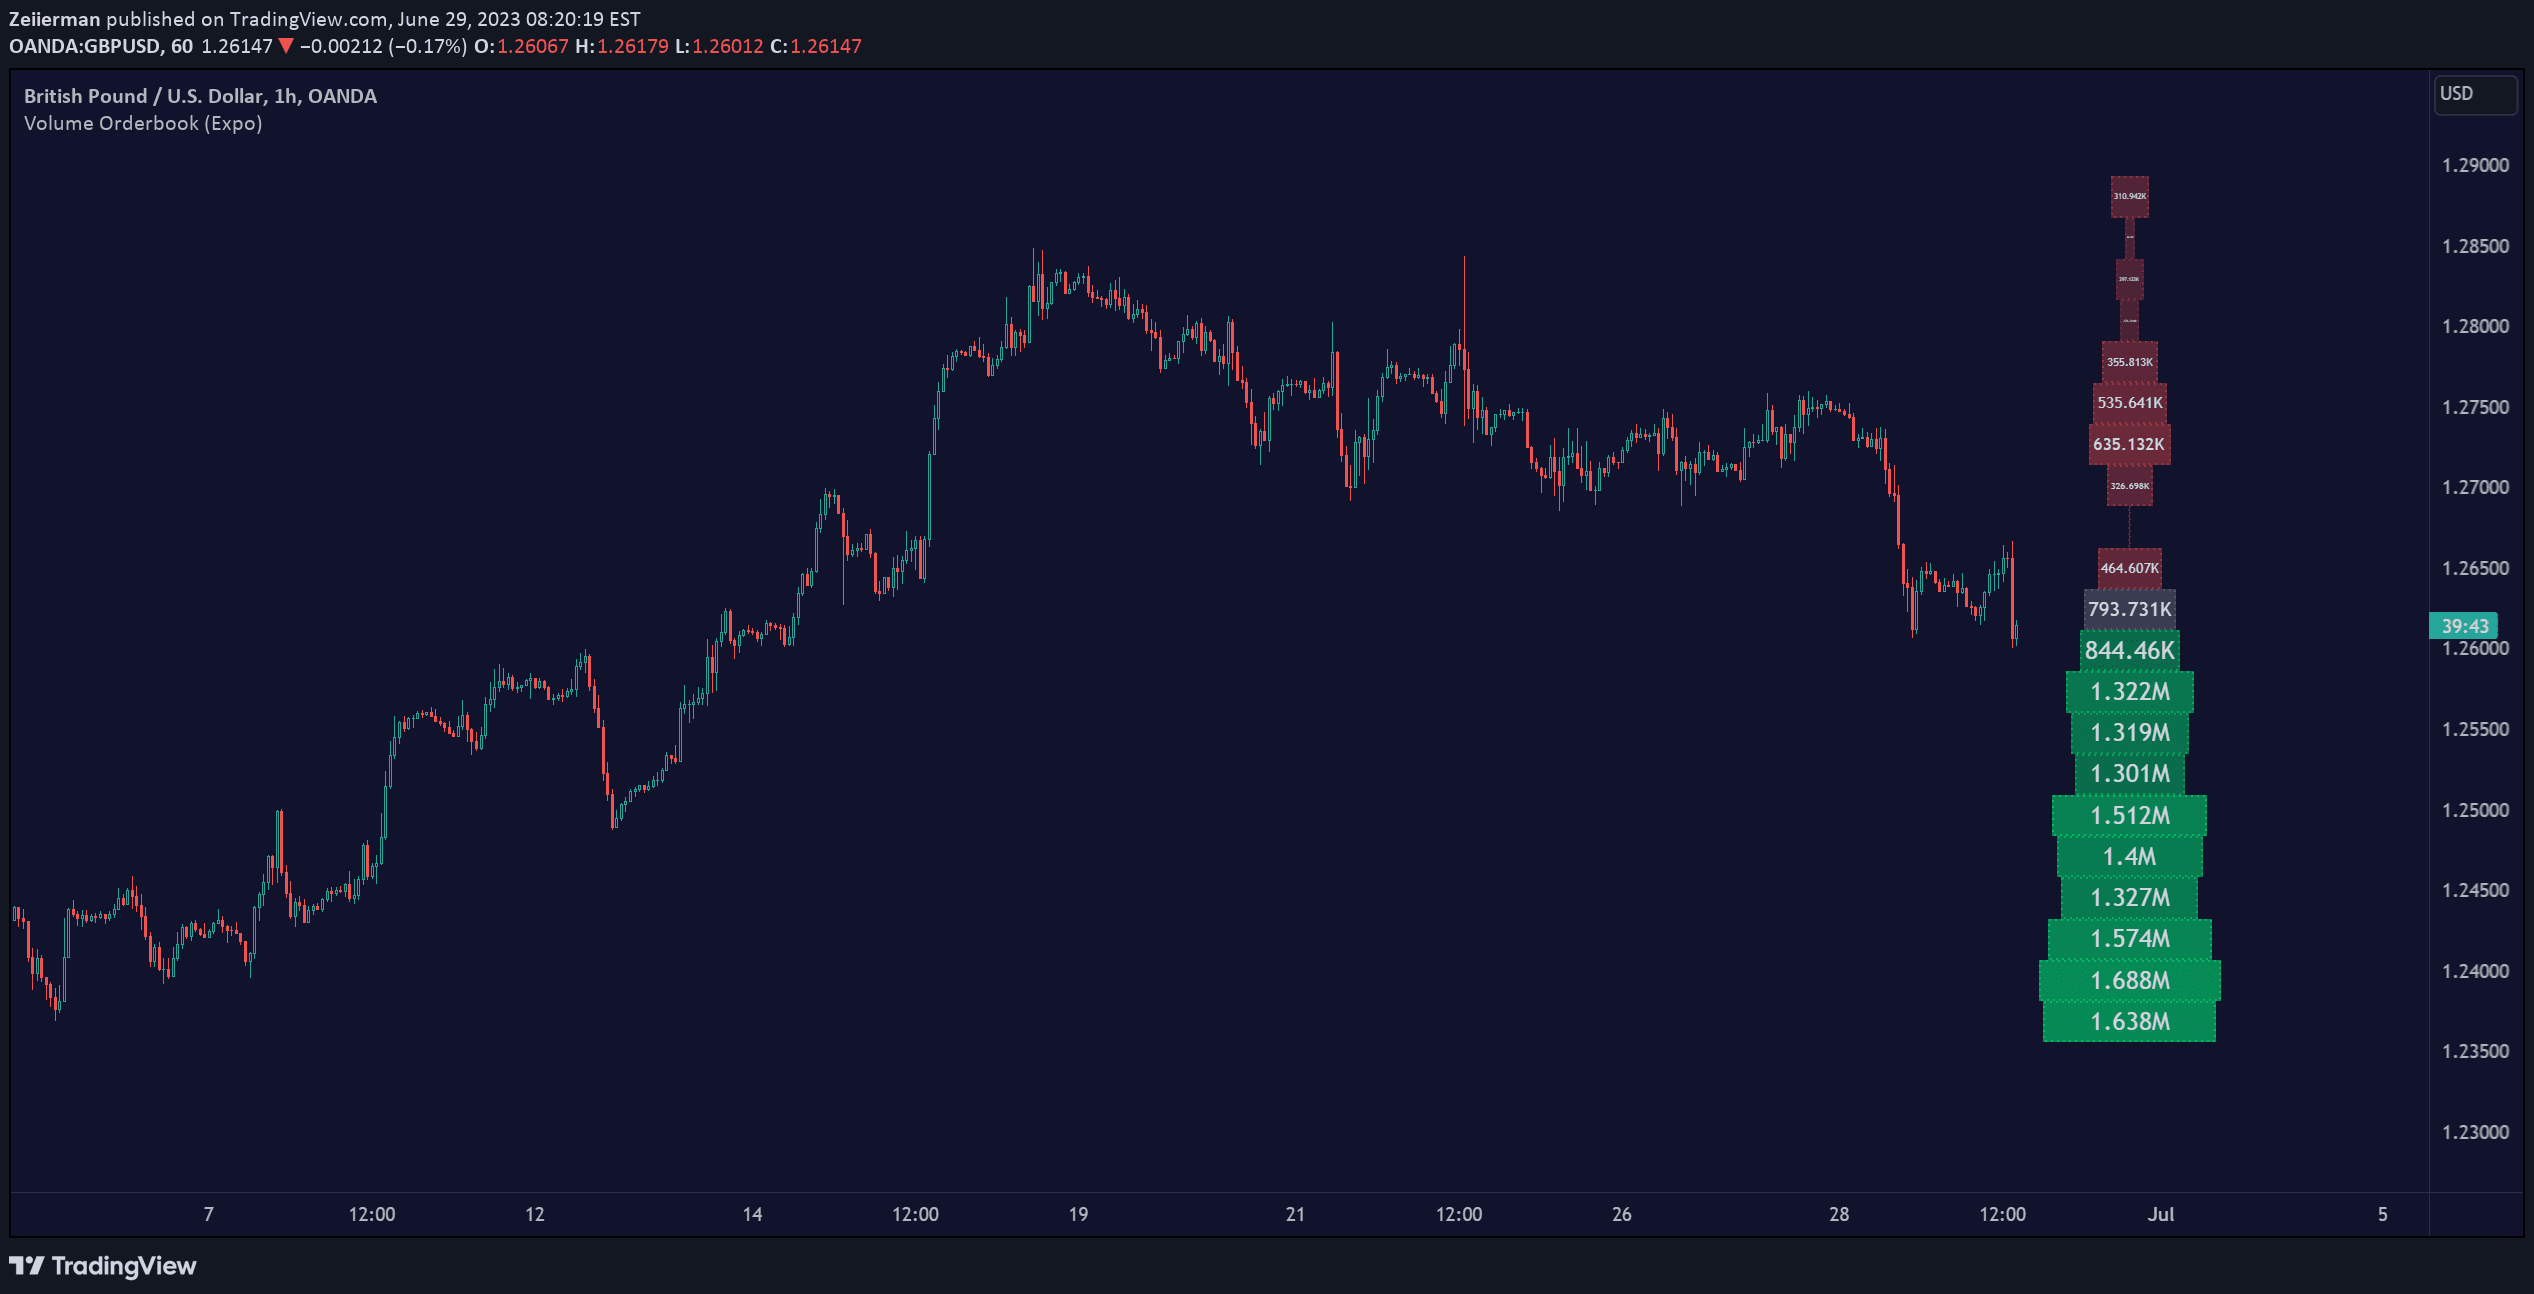
Volume Orderbook (Expo)
Volume Orderbook is a visual trading tool that displays trading volume across different price levels, helping traders identify significant market activity zones and potential support/resistance areas.
Explore 11,183 indicators. Filter beyond the obvious.
Discover the tools that fit the way you trade.
11,183 tools to explore
Volume Orderbook is a visual trading tool that displays trading volume across different price levels, helping traders identify significant market activity zones and potential support/resistance areas.
A moving average indicator with color-coded trend signals that plots when price crosses the moving average, helping traders identify potential trend reversals and entry points.
A hybrid trading indicator combining Range Filter and Hull Suite to identify trend entry signals by analyzing bar colors and moving average trends across different market conditions.
Volume Profile indicator that analyzes trading volume at different price levels, revealing key volume points of control and high volume nodes for trading insights.
Historic Volume/Market Profile is a comprehensive trading indicator that analyzes volume clusters and market profiles across multiple historical periods with enhanced granularity and visualization.
A specialized indicator that detects high-volume trading bars by comparing current volume against a moving average and customizable volume multiplier settings.
A volume-based technical analysis tool that visualizes trading volume across price levels, helping traders identify key support, resistance, and trading zones with precision.
An earnings gap analysis tool that identifies three types of stock price jumps after earnings reports, marking key price levels and tracking potential outperformance windows.
An advanced volume indicator that provides detailed volume analysis with color-coded volume bars, moving average insights, and unique volume labeling for comprehensive market trend assessment.
A comprehensive options volatility analysis tool that evaluates market conditions through historical volatility metrics, benchmarking, and regime detection to guide strategic options trading decisions.
TTMSqueeze is a volatility and momentum indicator that identifies market consolidation periods, signaling potential explosive price movements using Bollinger Bands and Keltner Channels.
A technical indicator combining Elliott Wave theory with derivative peak detection and breakout bands to analyze market trends and potential reversals through advanced oscillator analysis.
Likes, views, and comments are historical TradingView snapshots. They describe attention, not trading performance.
