ICT Implied Fair Value Gap (IFVG) [LuxAlgo]
An advanced trading indicator that detects price imbalances through a three-candle formation, highlighting potential support and resistance zones based on supply and demand disparities.
Explore 11,183 indicators. Filter beyond the obvious.
Discover the tools that fit the way you trade.
11,183 tools to explore
An advanced trading indicator that detects price imbalances through a three-candle formation, highlighting potential support and resistance zones based on supply and demand disparities.
The Bollinger Band Width Percentile measures relative volatility by calculating the percentage of historical periods where Bollinger Band width was narrower than the current period.
An advanced trading indicator identifying potential market imbalances through rapid price movements, analyzing order blocks and pivot points to detect areas of potential price revisits.
A volatility indicator using VIX to measure price deviation from VWAP, primarily designed for SPY. It calculates standard deviation moves based on implied volatility, helping traders understand potential price ranges.
A trading indicator that defines specific market sessions and visualizes price ranges through defining ranges (DR) and implied defining ranges (IDR) with color-coded graphical elements.
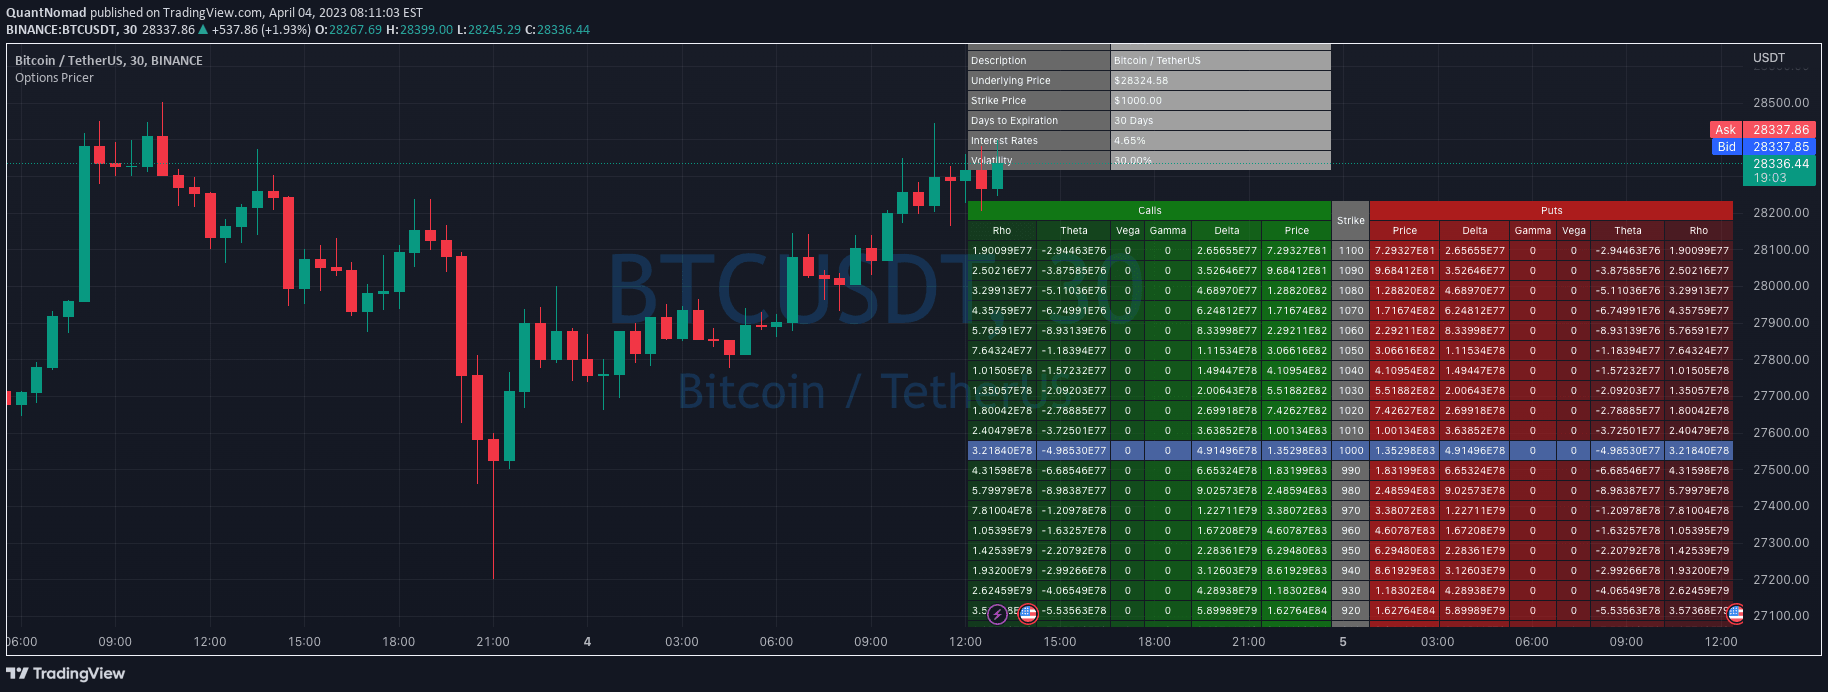
A TradingView option pricing tool that computes option prices and greeks for both put and call options using strikes, implied volatility, and days to expiry.
A comprehensive options pricing and risk analysis tool using the Black-Scholes model, providing theoretical option prices, Greeks, and implied volatility for accurate options trading insights.
A straddle strategy analyzing call and put option prices to predict potential market movement within a specific range using technical indicators like Supertrend and EMA.
A technical analysis tool identifying hidden supply and demand zones through a unique three-candlestick formation, helping traders predict potential price reversals and high-probability trading opportunities.
The Black-Scholes-Merton model is a sophisticated options pricing framework that calculates theoretical option values using key financial parameters and multiple Greek sensitivity measures.
A comprehensive market analysis tool tracking cross-market correlations and equity factor performance across multiple assets to provide probabilistic insights into macro market regimes and potential future movements.
A trading tool that plots expected price move boxes using implied volatility from options, helping traders visualize potential price ranges for weekly, monthly, and yearly timeframes.
Likes, views, and comments are historical TradingView snapshots. They describe attention, not trading performance.