Pure Price Action ICT Tools [LuxAlgo]
A comprehensive price action analysis tool that automatically identifies market structures, liquidity levels, order blocks, and potential trend shifts using pure price movement patterns.
Explore 11,183 indicators. Filter beyond the obvious.
Discover the tools that fit the way you trade.
11,183 tools to explore
A comprehensive price action analysis tool that automatically identifies market structures, liquidity levels, order blocks, and potential trend shifts using pure price movement patterns.
Ghost Tangent Crossings is an innovative pivot point indicator that visualizes market movements using ellipses, dynamically tracking zig-zag patterns and potential price breakouts.
The RMI Trend Sniper is a sophisticated trend-following indicator that combines RSI and MFI to generate momentum signals and identify potential market trend reversals.
A dynamic trading indicator that identifies potential breakout opportunities by visualizing price ranges and offering customizable risk management through target and stop loss settings.
A price action indicator that detects liquidity sweeps by identifying key swing points and tracking price movements through critical liquidity levels without complex numerical settings.
A technical analysis tool that identifies dynamic support and resistance levels by connecting past pivot high and low points, which can be applied to various indicators and chart types.
A custom moving average using a beta distribution weighting function that allows traders to control lag and smoothness, offering flexible trend analysis with adjustable parameters.
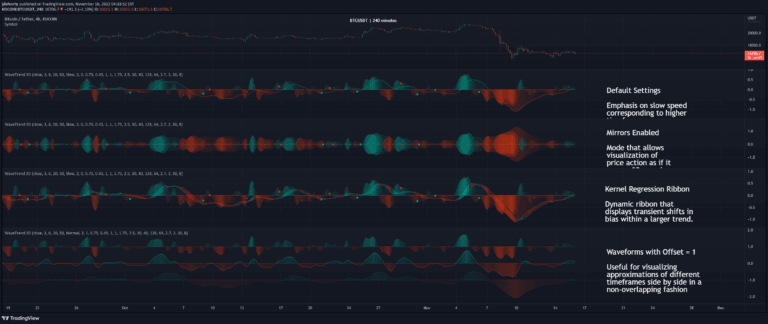
WaveTrend 3D is an advanced oscillator that uses digital signal processing and machine learning techniques to analyze price trends with enhanced precision and multi-timeframe support.
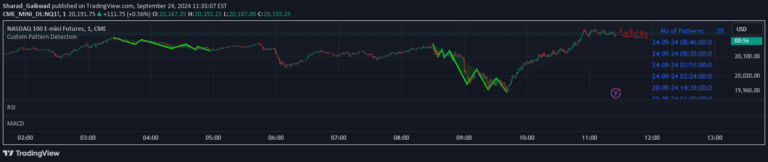
A customizable chart pattern detection tool that allows traders to define and identify specific pattern formations across multiple market scenarios using flexible input parameters.
A sophisticated logistic regression indicator that identifies and predicts support and resistance levels using advanced statistical modeling and market condition analysis.
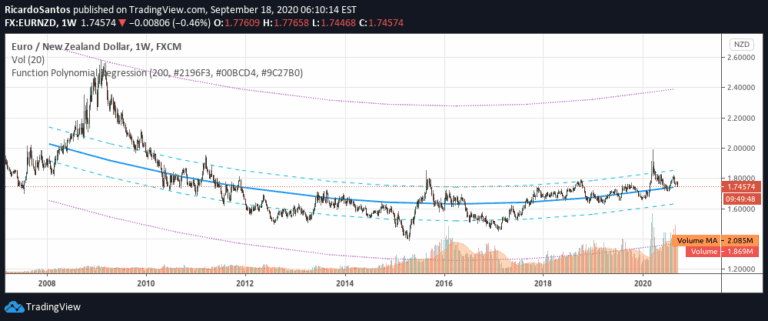
A polynomial regression function that analyzes data points to provide predictions, deviations, and statistical insights about trend and momentum patterns in financial datasets.
Wave Consolidation indicator identifies market consolidation zones using market profiles, highlighting areas of potential support and resistance through volume and price action analysis.
Likes, views, and comments are historical TradingView snapshots. They describe attention, not trading performance.