YOUR INDICATOR RESEARCH STARTS HERE

Find the right indicator.
Understand what it does.

Explore 11,183 indicators. Filter beyond the obvious.
Discover the tools that fit the way you trade.

THE INDICATOR LIBRARY

Results for “investment”

11,183 tools to explore

677 indicators matching your filters
Save search
VolumeTrend

Global Liquidity Index

by QuantitativeAlpha

Global Liquidity Index tracks worldwide central bank balance sheets, providing a comprehensive view of global monetary conditions and potential market trends through consolidated financial data.

Separate pane · unverifiedSwing Trading
Explore
7.5Klikes212.7Kviews110comments
Save
VolumeVolatilityEditor’s pick

Anti-Volume Stop Loss

by Rafka

An advanced stop-loss strategy that uses volume, price, and volatility to dynamically adjust stop-loss levels, helping traders manage risk by considering individual security characteristics.

Main price chart · unverifiedDay Trading · Swing Trading
Explore
6Klikes155.2Kviews56comments
Save
TrendMomentumEditor’s pick

Next Pivot Projection [Trendoscope]

by Trendoscope

A trading script that projects future pivot points by analyzing historical price patterns and calculating potential next pivot locations using statistical analysis of market movements.

Main price chart · unverifiedSwing Trading
Explore
4.1Klikes163.9Kviews136comments
Save
LevelsSignal

Quarterly Earnings

by finallynitin

A TradingView script that displays quarterly earnings per share and sales data with year-on-year percentage changes, offering customizable visualization of financial performance metrics.

Main price chart · unverifiedSwing Trading
Explore
3.7Klikes44.7Kviews66comments
Save
MomentumTrend

RS Rating

by Fred6724

The RS Rating evaluates a stock's price performance relative to the market over 52 weeks, helping traders identify stocks that are outperforming and potentially poised for further gains.

Separate pane · unverifiedDay Trading · Swing Trading
Explore
3.4Klikes45.4Kviews223comments
Save
TrendSignalEditor’s pick

Industry Group Strength

by Amphibiantrading

A trading tool that identifies top-performing stocks within specific industry groups by analyzing performance metrics like YTD return and relative strength.

Separate pane · unverifiedDay Trading · Swing Trading
Explore
3.1Klikes75.2Kviews58comments
Save
TrendVolatilityEditor’s pick

Monte Carlo Simulation - Random Walk

by LonesomeTheBlue

Monte Carlo Simulation is a predictive modeling technique that uses random sampling to generate multiple potential price paths and forecast market scenarios based on historical data.

Main price chart · unverifiedDay Trading · Swing Trading
Explore
2.9Klikes41.8Kviews49comments
Save
VolumeTrendSignal

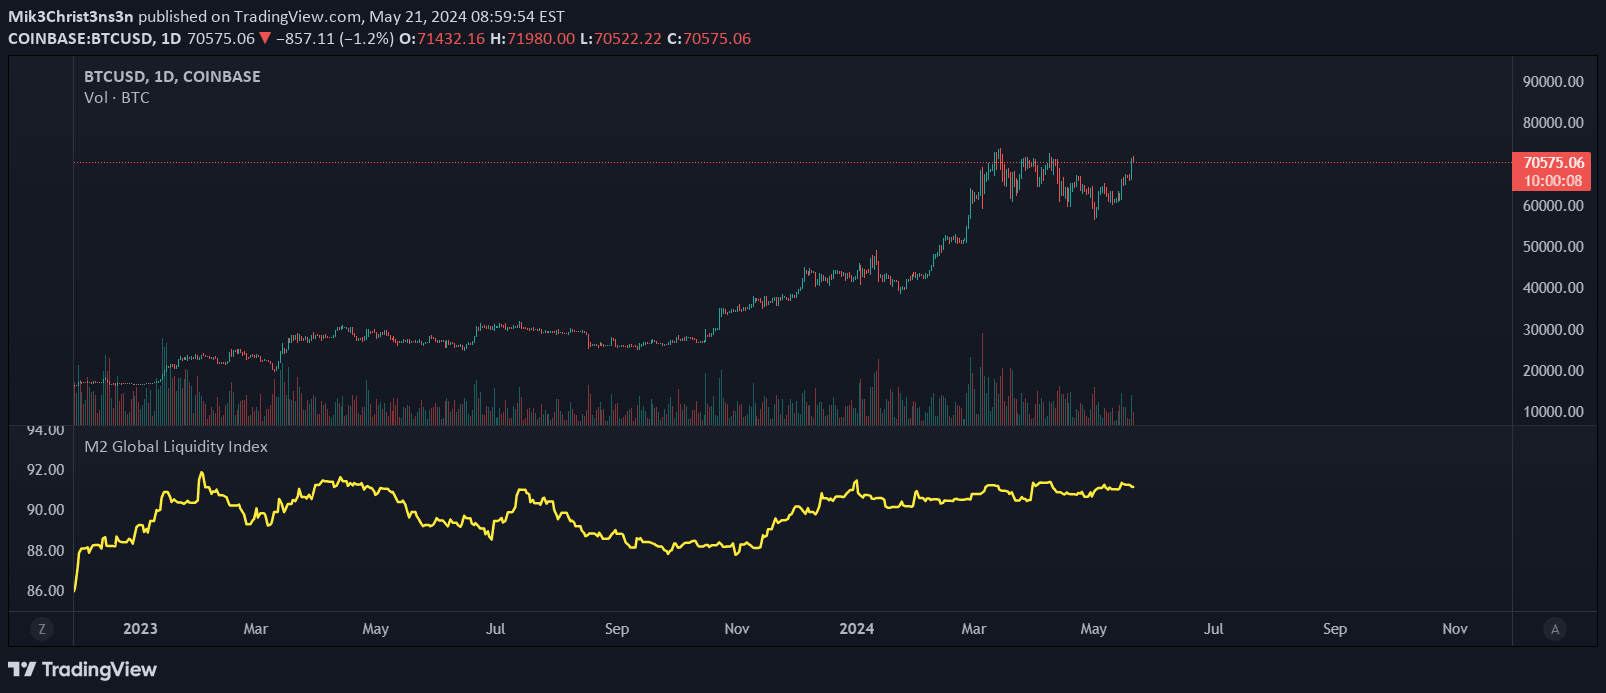
M2 Global Liquidity Index

by Mik3Christ3ns3n

The M2 Global Liquidity Index tracks aggregate money supply across five major currencies, providing a comprehensive view of global economic liquidity and potential market trends.

Separate pane · unverifiedSwing Trading
Explore
2.8Klikes72.7Kviews0comments
Save

Likes, views, and comments are historical TradingView snapshots. They describe attention, not trading performance.

START WITH A QUESTION

A little less searching.
A lot more understanding.

Tell DeepAlpha what you need. Get an explanation, a shortlist,
and a direct path to the indicators behind it.

Ask DeepAlpha