Color Gradient Framework [PineCoders]
A Pine Script color gradient generator that enables dynamic color generation for trading indicators, providing flexible visualization techniques for market analysis and signal representation.
Explore 11,183 indicators. Filter beyond the obvious.
Discover the tools that fit the way you trade.
11,183 tools to explore
A Pine Script color gradient generator that enables dynamic color generation for trading indicators, providing flexible visualization techniques for market analysis and signal representation.
A unique trading tool that overlays momentum oscillators within a logarithmic regression channel, providing dynamic insights into price trends and momentum positioning.
A precise indicator that identifies double top and bottom reversal patterns in market price action, helping traders recognize potential trend changes with customizable settings and visual enhancements.
A comprehensive trading indicator that identifies support and resistance levels, detects breakouts and retests, and provides volatility-based stop-loss management for enhanced technical analysis.
A forecasting indicator that analyzes candle wick-to-body ratios to predict potential price movements by comparing current candle characteristics with historical patterns.
A multi-RSI plotting technique that allows customization of five different RSI indicators with varying parameters like source, length, timeframe, color, and visual representation.
A market range indicator that identifies trading session boundaries and potential daily high/low points using predefined and custom time ranges for traders.
A comprehensive trading indicator that combines Money Flow Index, Relative Strength Index, and Bollinger Bands to generate precise buy and sell signals based on technical analysis.
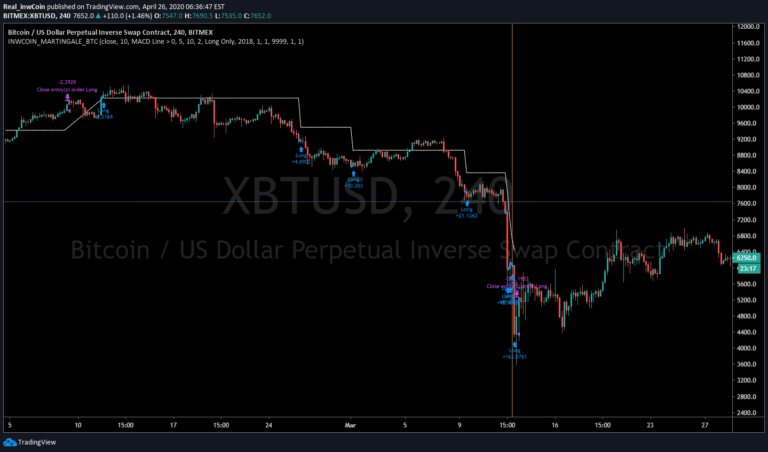
A risky trading strategy involving progressively doubling down on losing trades to recover losses, potentially generating high returns but with extreme portfolio risk.
A statistical method for identifying significant price movements by detrending time series and comparing candle sizes against a standardized distribution to detect anomalous trading events.
An advanced intraday trend indicator using Look Back Period and moving averages to dynamically track market trends with color-coded candles and trend lines.
A dynamic divergence indicator that calculates the magnitude and potential of divergences between price action and RSI, highlighting emerging trend reversals and momentum shifts.
Likes, views, and comments are historical TradingView snapshots. They describe attention, not trading performance.