
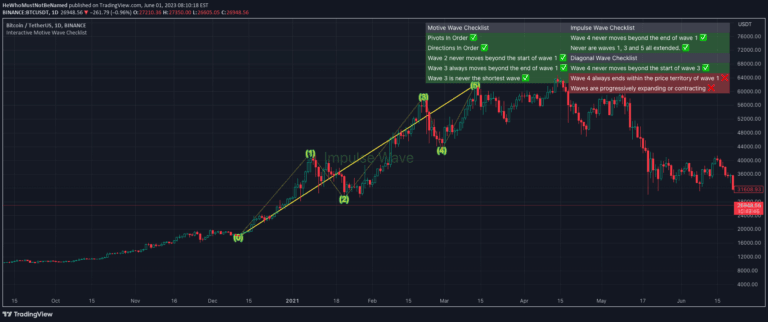
Interactive Motive Wave Checklist
Elliott Wave analysis is a technical trading method that identifies market trends by examining price wave patterns, helping traders predict potential market movements and trend reversals.
Explore 11,183 indicators. Filter beyond the obvious.
Discover the tools that fit the way you trade.
11,183 tools to explore
Elliott Wave analysis is a technical trading method that identifies market trends by examining price wave patterns, helping traders predict potential market movements and trend reversals.
A trading tool designed to help traders organize tasks, track journal entries, manage due dates, and maintain structure in their trading workflow with customizable note-taking capabilities.
A comprehensive trading script that recreates TradingView's watchlist stats panel, offering real-time performance metrics and historical comparisons across multiple timeframes.
Trading Checklist is a customizable indicator that helps traders maintain discipline by creating and displaying personalized trading rules directly on a TradingView chart.
An experimental trading signal utilizing an automatic growth model derived from historical market data, designed to predict potential price movements based on past performance patterns.
An advanced trading tool that auto-grades swing trade setups using 7 key Smart Money criteria, helping traders evaluate trade quality and potential entry points.
A dynamic ticker tape that displays real-time price updates and daily changes for multiple securities, scrolling horizontally across the chart bottom for instant market insights.
A trading strategy focused on identifying panic selling and buying opportunities across multiple symbols, providing real-time alerts and visual signals for potential market reversals.
A trading discipline script that helps traders maintain strategy consistency by creating customizable confirmation checkboxes with color-coded tracking for trade entry criteria.
Multi-indicator stock scanner that combines MACD, EMA200, Supertrend, and Half Trend to generate real-time buy and sell signals across 36 Nifty 50 stocks.
A comprehensive cryptocurrency market monitoring tool that tracks indices, currency pairs, and real-time market developments across multiple indicators and metrics.
A dynamic grid display showing real-time currency pair exchange rates and daily percentage changes across multiple currencies, enabling comprehensive forex market monitoring.
Likes, views, and comments are historical TradingView snapshots. They describe attention, not trading performance.