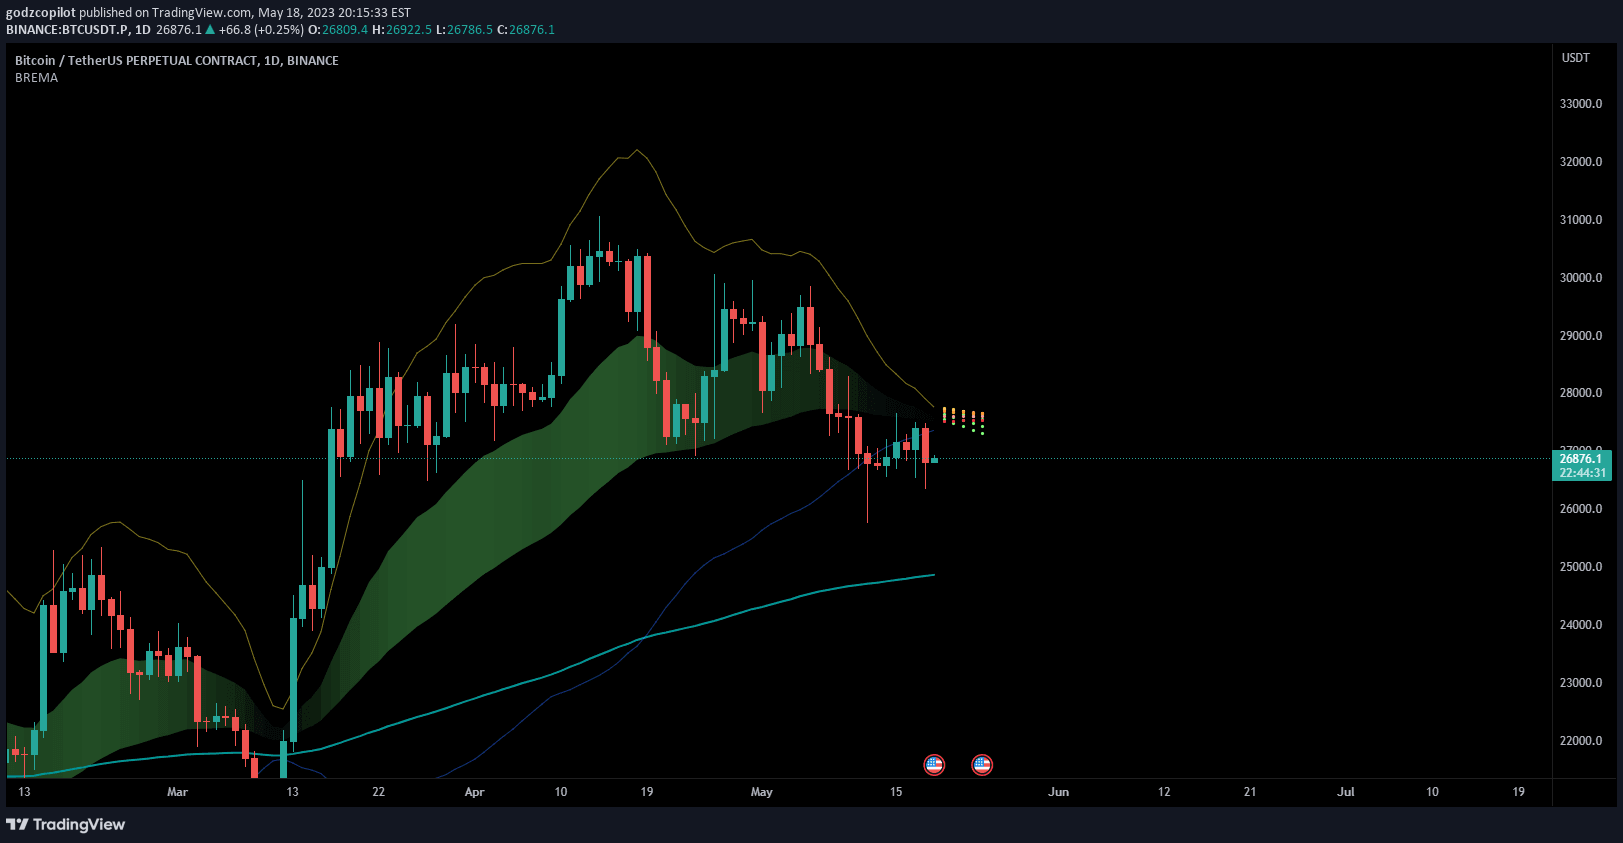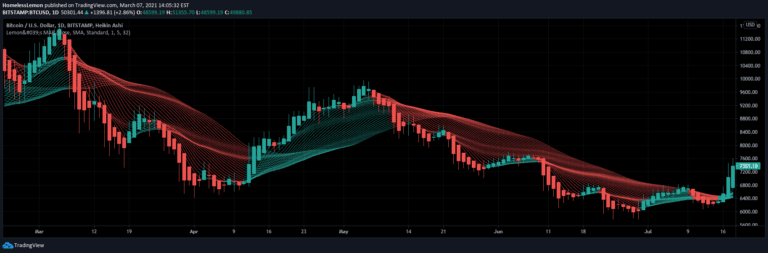
Customizable MA Ribbon
A customizable moving average ribbon indicator that helps traders analyze trend strength and direction by plotting multiple moving averages with adjustable parameters and visual themes.
Explore 11,183 indicators. Filter beyond the obvious.
Discover the tools that fit the way you trade.
11,183 tools to explore
A customizable moving average ribbon indicator that helps traders analyze trend strength and direction by plotting multiple moving averages with adjustable parameters and visual themes.
A multi-timeframe moving average ribbon that dynamically tracks market trends using EMA and SMA with customizable lengths and visual indicators.
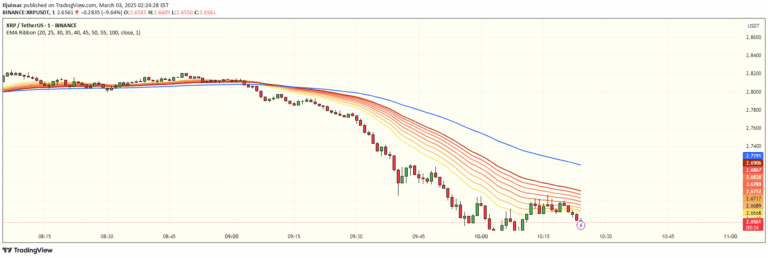
An EMA ribbon strategy using multiple exponential moving averages to analyze trend strength and momentum through gradient color visualization and ribbon separation.
Volume Flow Indicator (VFI) analyzes volume movement relative to price, providing insights into market sentiment by tracking volume's directional flow and using median price calculations.
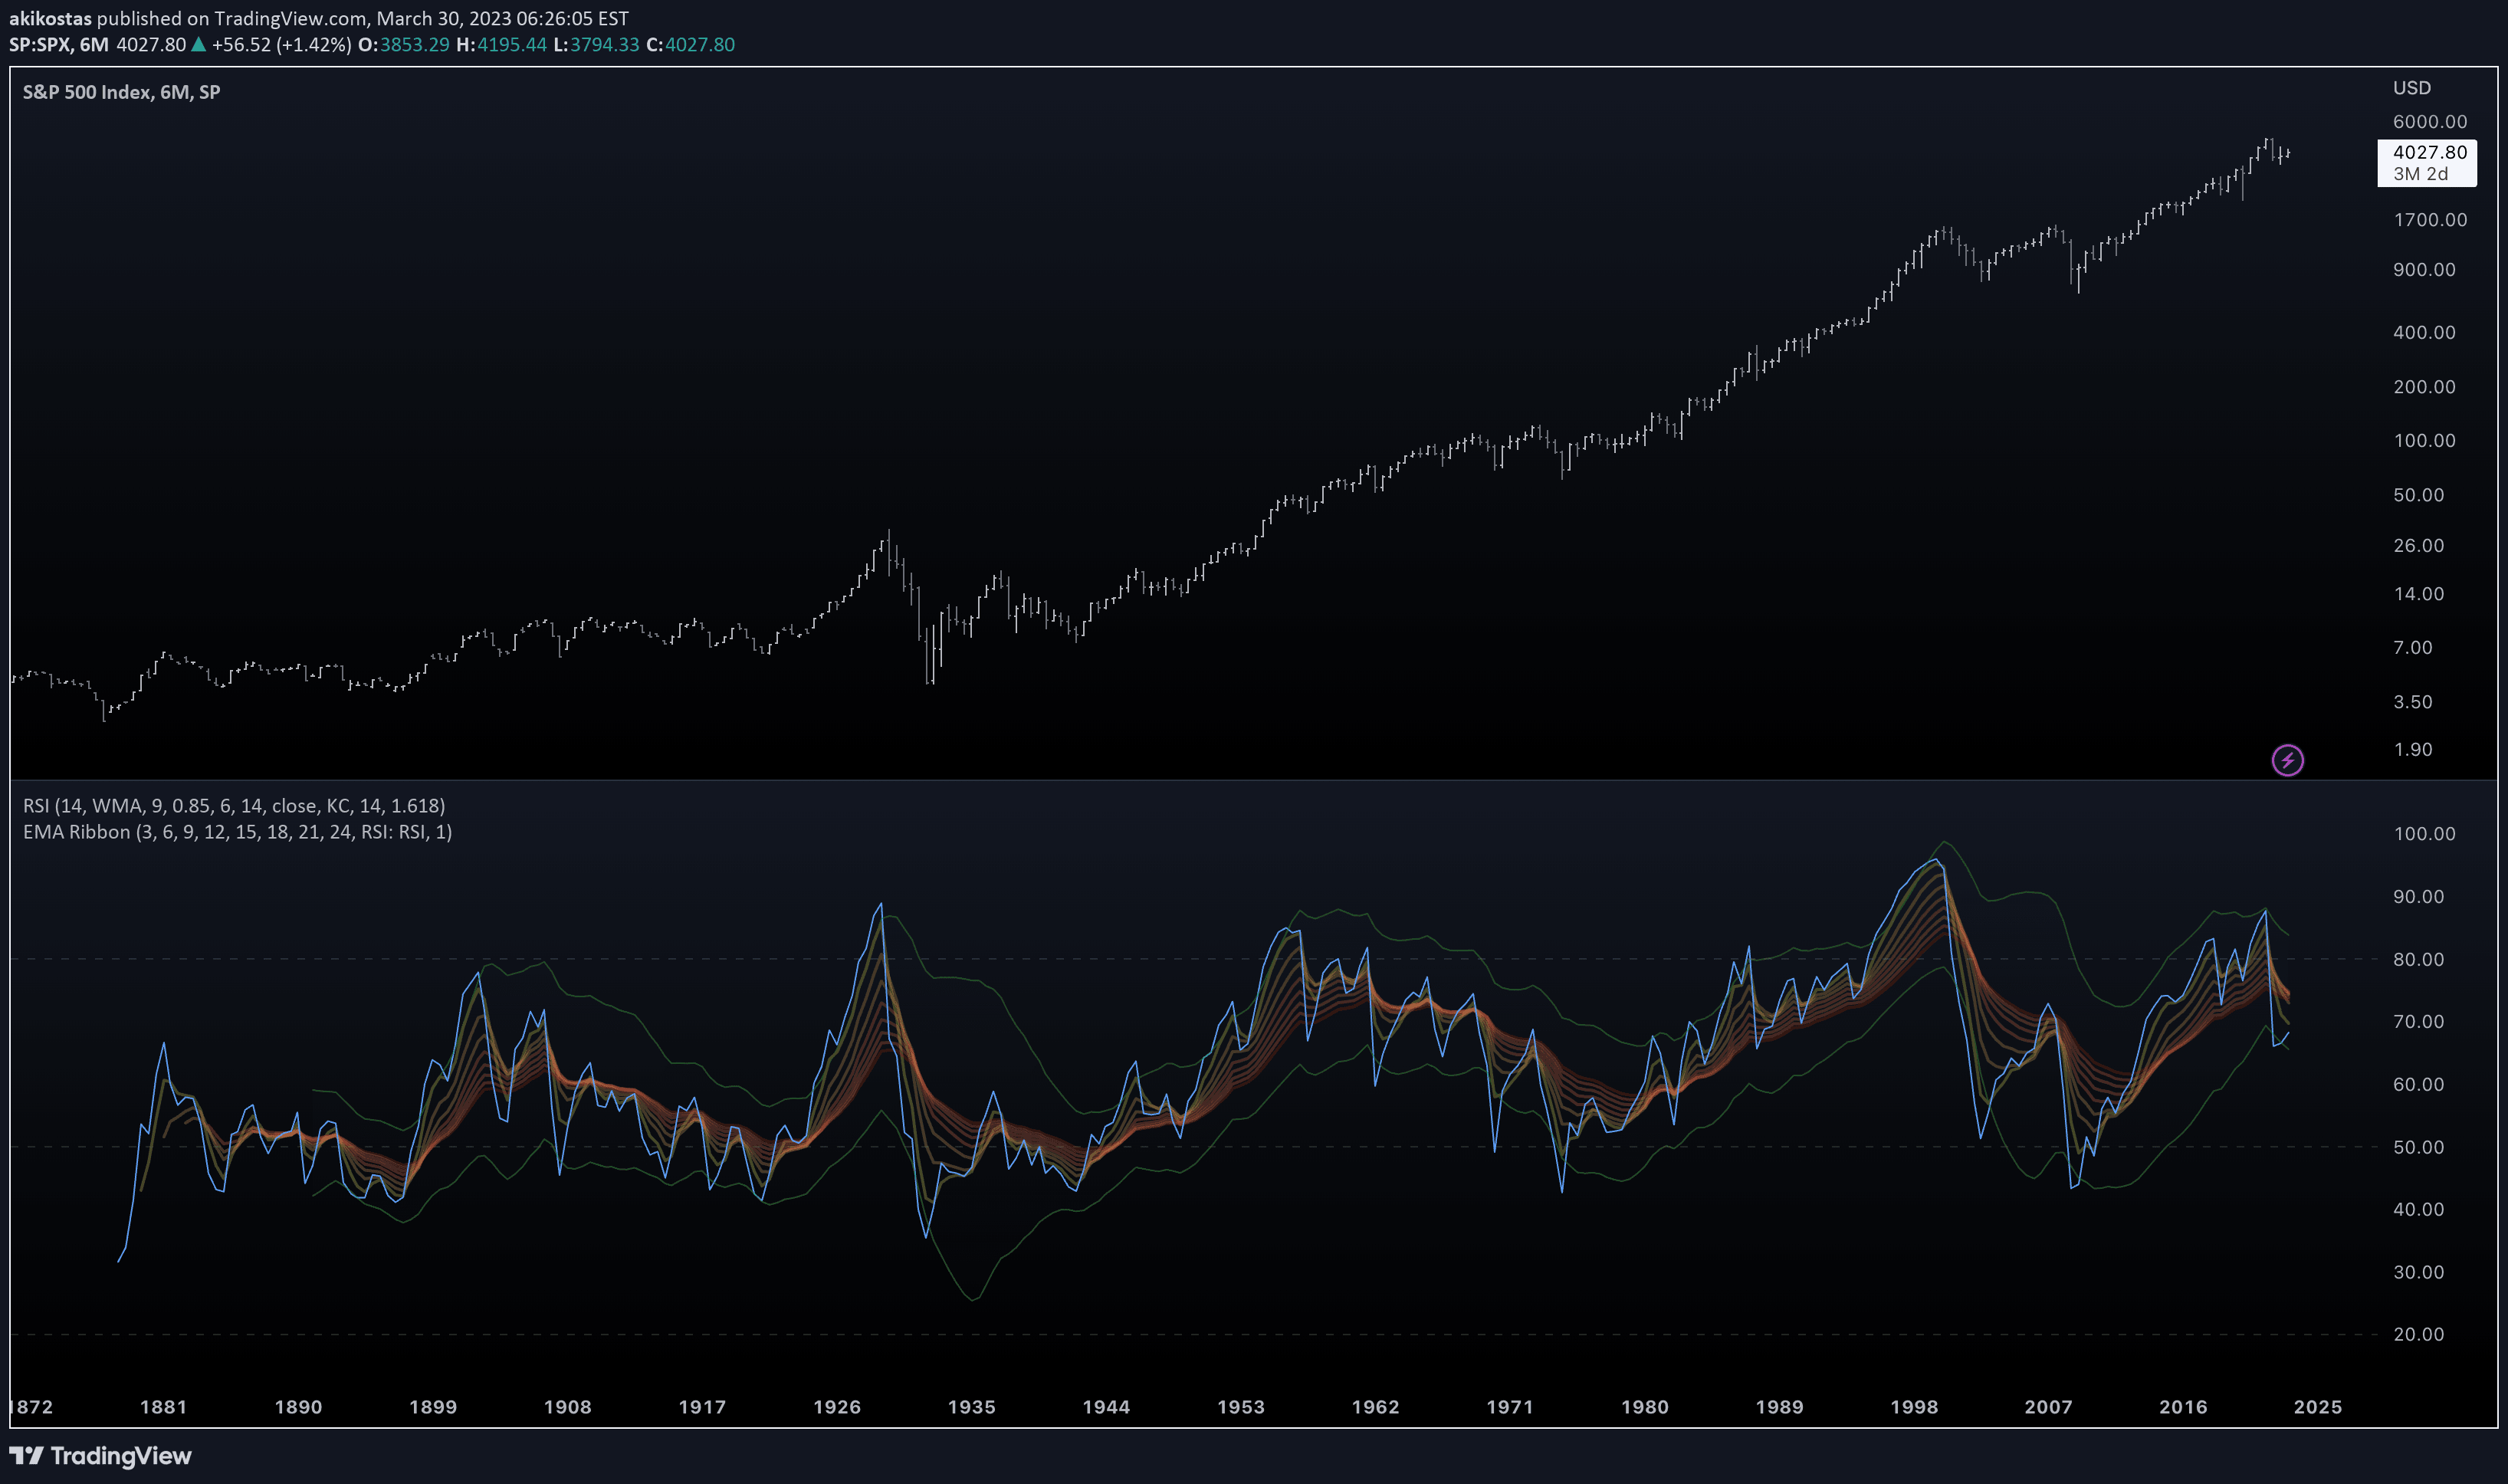
A custom RSI indicator enhanced with Keltner Channels to provide advanced insights into market momentum and potential overbought/oversold conditions beyond traditional RSI levels.
A custom indicator measuring price distance from moving average, providing unique trend-based support and resistance levels with exotic calculations for zero-value charts.
An advanced moving average tool featuring multiple SMA periods with a dynamic 200-period MA that changes color and can be locked to the daily timeframe for comprehensive trend analysis.
An EMA Ribbon indicator that visualizes market trends through a dynamic color-changing overlay, helping traders quickly identify trend shifts and potential entry/exit points.
The EMA Ribbon is a multi-period moving average indicator that reveals trend direction and strength by plotting color-coded exponential moving averages across different timeframes.
An advanced indicator combining EMA Ribbon and ADX to identify trend direction and strength, offering clear visual signals and momentum confirmation for traders.
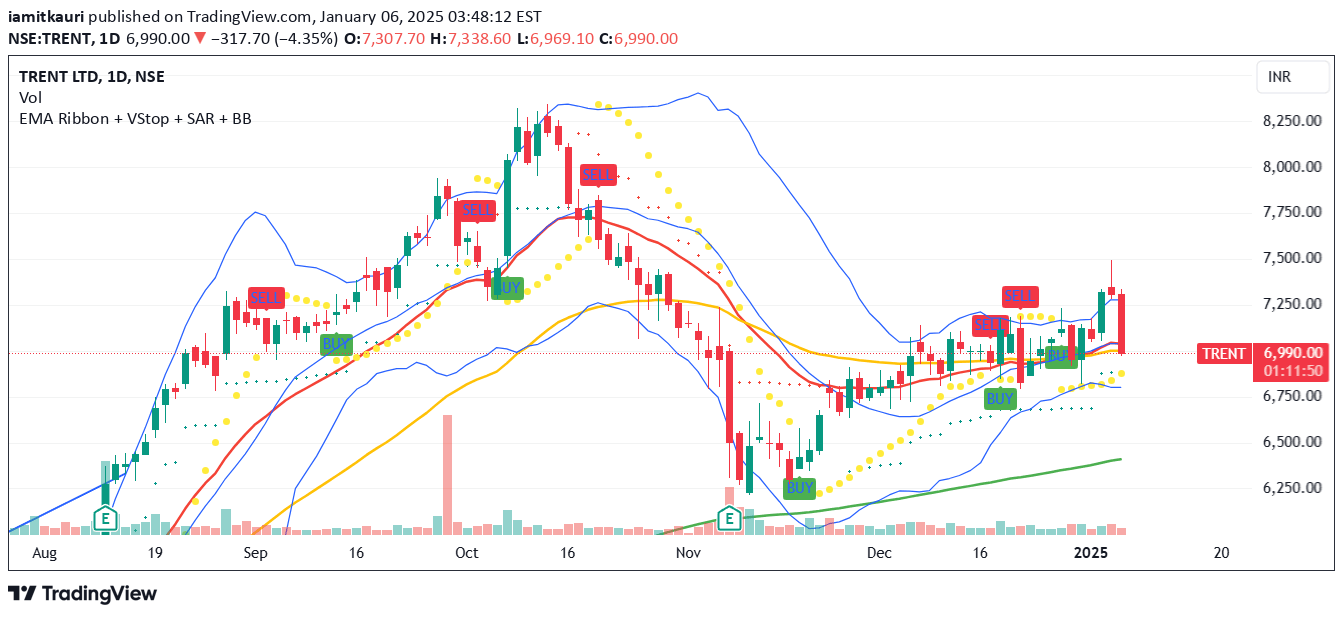
A comprehensive technical analysis approach combining multiple indicators to identify market trends, entry/exit points, and manage risk through adaptive strategies.
A multi-layered trading indicator blending Exponential Moving Averages (5, 9, 21) with VWAP to identify momentum shifts and volume-confirmed trend signals across different timeframes.
Likes, views, and comments are historical TradingView snapshots. They describe attention, not trading performance.