Auto Chart Patterns [Trendoscope®]
An advanced algorithmic indicator that automatically identifies and classifies complex chart patterns by analyzing trend lines, pivot points, and geometric formations across multiple timeframes.
Explore 11,183 indicators. Filter beyond the obvious.
Discover the tools that fit the way you trade.
11,183 tools to explore
An advanced algorithmic indicator that automatically identifies and classifies complex chart patterns by analyzing trend lines, pivot points, and geometric formations across multiple timeframes.
A technical analysis script that identifies cup-like price formations by creating channels and tracking potential breakout points in financial markets using specific bar search and channel width parameters.
Tick Chart is a unique charting method that creates candlesticks based on a specific number of price ticks, offering an alternative to time-based charts for analyzing market movements.
A comprehensive market sentiment indicator that synthesizes multiple technical analysis techniques into a single value, providing insights into market direction, momentum, and potential trend reversals.
A trailing stop strategy that uses market structure like Change of Character (CHoCH) and Break of Structure (BOS) to dynamically adjust stop-loss levels for protecting profits.
A tool that identifies potential price reversal zones using statistical probability by analyzing historical swing points and calculating precise percentile-based predictions.
An advanced trading indicator that identifies specific market timing intervals where algorithmic trading creates or interacts with liquidity at predetermined times.
Range Sentiment Profile analyzes price variations within predefined price areas, highlighting bullish and bearish sentiment through color-coded profile bins across recent price ranges.
A unique trading indicator combining Murrey Math formulas with Fibonacci retracement levels to identify potential market tops, bottoms, and long-term trend dynamics with enhanced precision.
A market structure indicator that detects breaker blocks, extending swing levels and highlighting potential support/resistance zones through price interactions and breakout events.
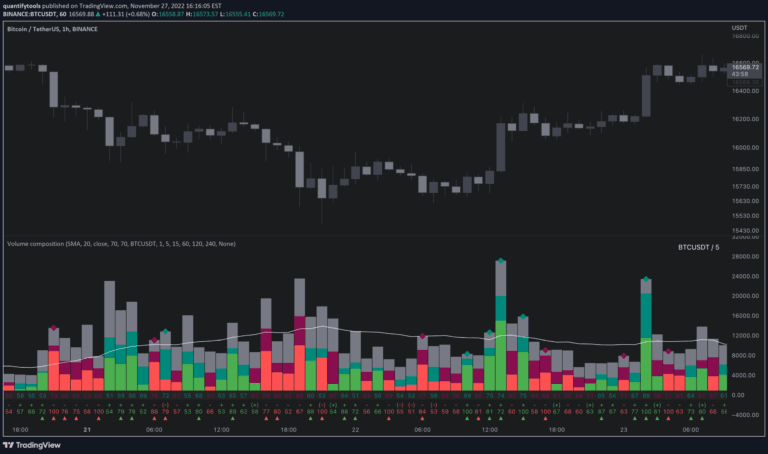
Volume composition indicator that breaks down trading volume into buy, sell, passive, and active components to provide deeper insights into market liquidity and potential price movements.
A technical analysis tool that identifies price gaps between consecutive candlesticks, creating windows that signal potential trend continuation or reversal points.
Likes, views, and comments are historical TradingView snapshots. They describe attention, not trading performance.