Auto Pitchfork, Fib Retracement and Zig Zag by DGT
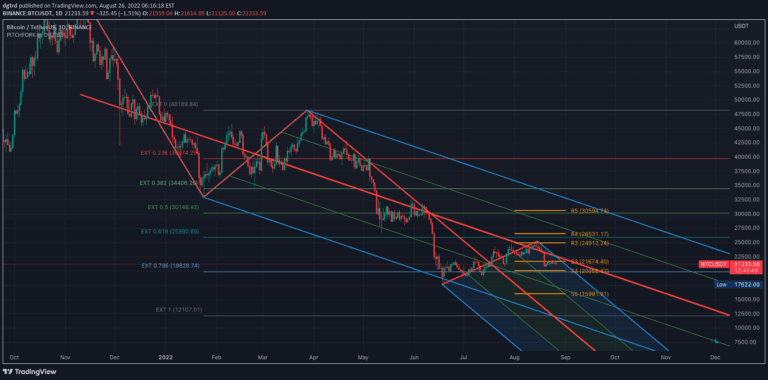
Pitchfork is a technical indicator that helps traders identify potential support and resistance levels by drawing trend lines based on three strategic points in price movement.
Explore 11,183 indicators. Filter beyond the obvious.
Discover the tools that fit the way you trade.
11,183 tools to explore
Pitchfork is a technical indicator that helps traders identify potential support and resistance levels by drawing trend lines based on three strategic points in price movement.
HARSI is a unique oscillator combining Heikin Ashi candles with RSI calculations, designed to reduce noise and provide smoother trend analysis for traders.
A modified Supertrend indicator that adjusts ATR calculations based on candle colors to provide more precise stop loss and trend tracking in volatile markets.
A sophisticated technical analysis tool combining LOWESS smoothing and adaptive Gaussian moving average to detect trends, pivot points, and breakouts with enhanced market dynamics visualization.
A parametric moving average with adjustable lag and overshoot, providing customizable trend analysis and potential reversal points using a modified sinewave kernel.
A comprehensive trading strategy combining Keltner Channels and Supertrend with fifteen EMAs to generate precise buy and sell signals for trend identification and market analysis.
A moving average indicator with color-coded trend signals that plots when price crosses the moving average, helping traders identify potential trend reversals and entry points.
A modified On Balance Volume (OBV) indicator that adds smoothing techniques and a signal line to help traders identify potential entry and exit points in financial markets.
A trend strength indicator using Modified Hull Moving Average with a visual gauge that shows trend direction and intensity through color and transparency gradients.
On-Balance Volume (OBV) is a technical analysis tool that aggregates trading volume to measure buying and selling pressure, helping traders identify potential trend reversals and market momentum.
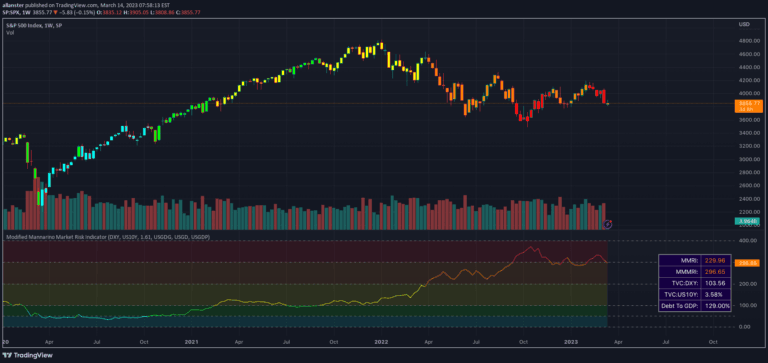
The Modified Mannarino Market Risk Indicator (MMMRI) evaluates market risk by analyzing debt, USD strength, and interest rates to provide a comprehensive risk assessment tool for traders.
Asset Rotation Aperture tracks volume accumulation across multiple assets, visualizing capital rotation and market narratives through normalized cumulative volume lines.
Likes, views, and comments are historical TradingView snapshots. They describe attention, not trading performance.