Reversal Candlestick Structure [LuxAlgo]
A candlestick pattern detection tool that identifies potential trend reversals using multiple pattern recognition techniques and stochastic oscillator filtering.
Explore 11,183 indicators. Filter beyond the obvious.
Discover the tools that fit the way you trade.
11,183 tools to explore
A candlestick pattern detection tool that identifies potential trend reversals using multiple pattern recognition techniques and stochastic oscillator filtering.
An advanced trading indicator that identifies specific market timing intervals where algorithmic trading creates or interacts with liquidity at predetermined times.
A trading strategy focusing on identifying potential price continuation after 11:30 AM EST, using high/low of day zones and momentum indicators to signal trading opportunities.
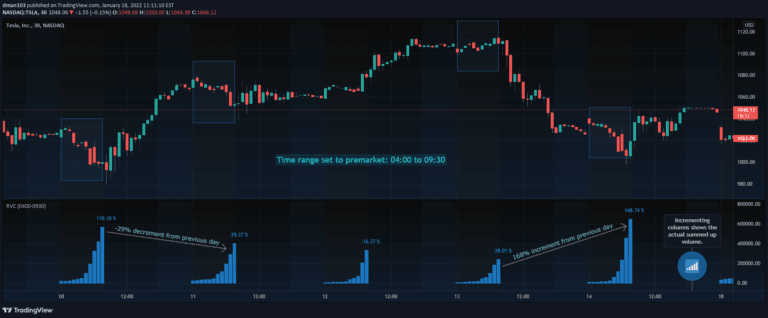
Range Volume Change (RVC) is a custom trading indicator that tracks volume percentage changes within a specific time range, helping traders understand volume dynamics across different trading periods.
A trading script that visualizes macro trading windows by marking specific time intervals with vertical lines and labels to help traders anticipate potential market liquidity and price movements.
An advanced trading strategy identifying Fair Value Gaps (FVGs) within specific market session periods to detect potential intraday trading opportunities and key price levels.
Advanced trading strategy identifying false price movements during early market hours by tracking liquidity-driven trades from major market players and detecting key institutional order zones.
An advanced trading indicator that identifies Open Range Gaps and 1-minute Fair Value Gaps, providing insights into market dynamics and potential price movements after market open.
ICT Macros is a trading tool that identifies key market moments, highlighting critical time intervals for trading opportunities based on liquidity shifts and price dynamics.
A TradingView indicator that identifies potential breakout and breakdown opportunities by tracking the initial 30-minute range of a trading session, generating buy and sell signals based on price movement.
A trading strategy identifying potential long entry opportunities by analyzing volume, price movements, and technical indicators to spot high-probability stock trades.
A technical analysis strategy combining Accumulation/Distribution and On-Balance Volume divergence with candlestick reversal patterns to identify potential market turning points and smart money movements.
Likes, views, and comments are historical TradingView snapshots. They describe attention, not trading performance.