Bjorgum Key Levels
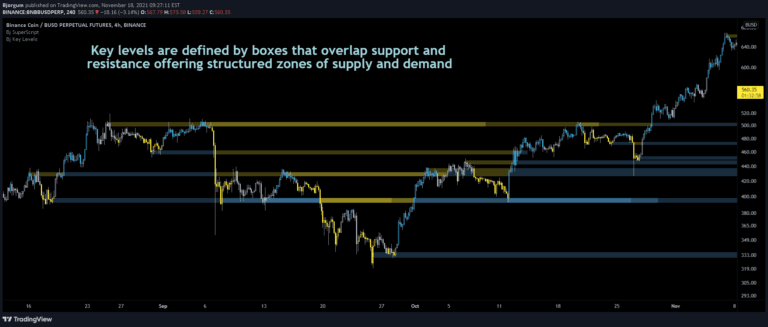
Key Levels strategy identifies critical price action points like breakouts, false breakouts, and backchecks to help traders understand market movement and potential trading opportunities.
Explore 11,183 indicators. Filter beyond the obvious.
Discover the tools that fit the way you trade.
11,183 tools to explore
Key Levels strategy identifies critical price action points like breakouts, false breakouts, and backchecks to help traders understand market movement and potential trading opportunities.
A multi-indicator divergence script that analyzes divergences across 10 different technical indicators to identify potential trend reversals and price movements.
A volume-based support and resistance indicator that identifies key trading levels through pivot points and volume analysis, providing visual cues for potential price reversals.
SuperBollingerTrend combines Bollinger Bands and SuperTrend to analyze market volatility and trend direction, providing traders insights into potential trend changes and breakouts.
Ghost Tangent Crossings is an innovative pivot point indicator that visualizes market movements using ellipses, dynamically tracking zig-zag patterns and potential price breakouts.
Renko Candles Overlay is a charting technique that transforms price action into uniform-sized bricks, offering a simplified visual representation of market trends and price movements.
A dynamic support and resistance indicator that predicts zones based on market trend, providing real-time insights into potential price reversal and continuation points.
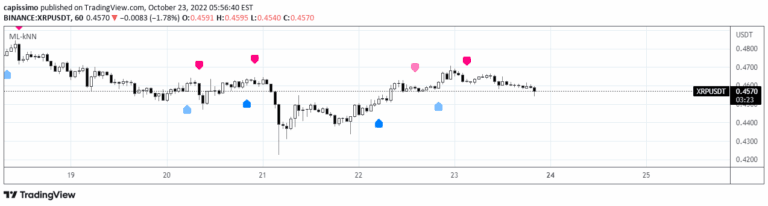
A k-Nearest Neighbours machine learning strategy that predicts market moves by analyzing historic data and finding similar past market conditions to forecast future price directions.
A trailing stop strategy that uses market structure like Change of Character (CHoCH) and Break of Structure (BOS) to dynamically adjust stop-loss levels for protecting profits.
Follow Line is a trend-following indicator that tracks price movements relative to Bollinger Bands, generating buy and sell signals based on price volatility and directional changes.
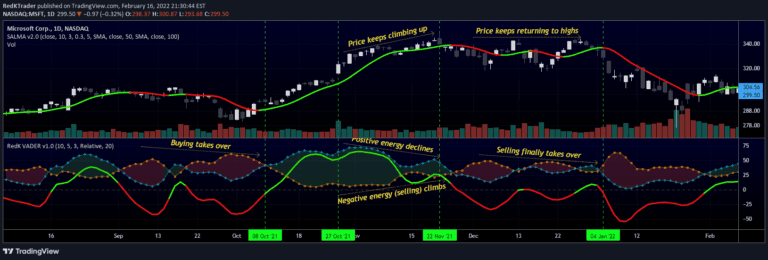
VADER is a volume-based technical indicator that measures market energy by analyzing price displacement and trading volume to determine bullish or bearish market sentiment.
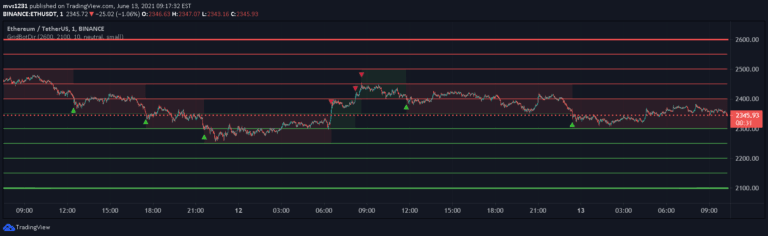
A grid trading bot simulator that divides price ranges into zones, generating trading signals based on price movement in ranging and trending markets with customizable grid settings.
Likes, views, and comments are historical TradingView snapshots. They describe attention, not trading performance.