
YOUR INDICATOR RESEARCH STARTS HERE

Find the right indicator.
Understand what it does.

Explore 11,183 indicators. Filter beyond the obvious.
Discover the tools that fit the way you trade.

THE INDICATOR LIBRARY

Results for “nonlinear”

11,183 tools to explore

14 indicators matching your filters
Save search
TrendMomentumEditor’s pick

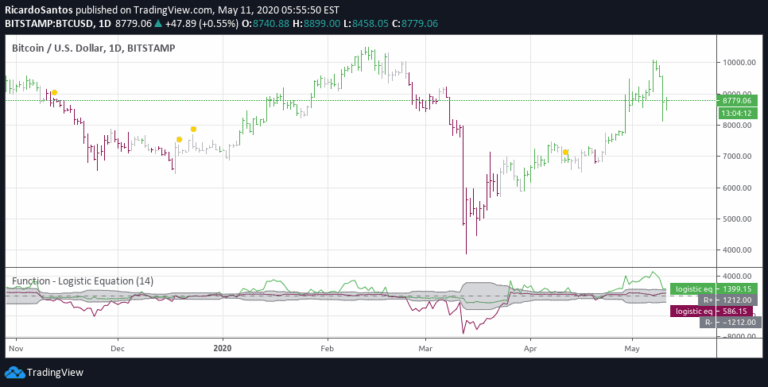
Function - Logistic Equation

by RicardoSantos

An experimental trading approach exploring the logistic equation's potential correlation with market dynamics, suggesting mathematical patterns might predict or explain market behavior.

Separate pane · unverifiedSwing Trading
Explore
748likes12.8Kviews14comments
Save
TrendSignal

Bitcoin Limited Growth Model

by EliCobra

An advanced Bitcoin price prediction model using Stock-to-Flow ratio with nonlinear analysis, offering refined insights into cryptocurrency market dynamics and potential price movements.

Separate pane · unverifiedSwing Trading
Explore
737likes8.8Kviews2comments
Save
TrendMomentum

[NLR] - MACD Overlay

by NonLinearRookie

An enhanced MACD indicator that visually represents trend direction using color-coded moving averages and a zero reference line, offering insights into market momentum and trend shifts.

Separate pane · unverifiedDay Trading · Swing Trading
Explore
465likes8.3Kviews13comments
Save
Momentum

Double MACD Overlay [NLR]

by NonLinearRookie

A dual MACD indicator that plots two momentum signals on a price chart, helping traders identify trend direction and potential momentum shifts through different timeframe comparisons.

Separate pane · unverifiedScalping · Day Trading
Explore
380likes5.8Kviews1comments
Save
MomentumSignalTrend

HMA Breakdown [NLR]

by NonLinearRookie

Hull Moving Average (HMA) with advanced components that break down trend dynamics, revealing momentum, divergence, and potential trend reversals through multi-layered visual analysis.

Main price chart · unverifiedScalping · Day Trading
Explore
300likes4.8Kviews1comments
Save
SignalTrendVolatility

Half Supertrend [NLR]

by NonLinearRookie

A dynamic Supertrend indicator that introduces a mid-level line to enhance trend analysis by providing deeper insights into trend strength and potential entry points.

Main price chart · unverifiedScalping · Day Trading
Explore
195likes3.2Kviews0comments
Save
Momentum

Stochastic Overlay [NLR]

by NonLinearRookie

A Stochastic Oscillator overlay that integrates momentum analysis directly onto the price chart, providing visual cues for potential trend reversals and market conditions.

Main price chart · unverifiedDay Trading · Swing Trading
Explore
175likes2.4Kviews1comments
Save
TrendSignalLevels

[NLR] - SweetSpot Zones

by NonLinearRookie

The Sweet Spot Zone helps traders identify optimal entry points in trending markets by creating color-coded zones and a base point for precise trade entries.

Main price chart · unverifiedScalping · Day Trading
Explore
170likes2.4Kviews0comments
Save
TrendSignal

Realtime HTF Candle [NLR]

by NonLinearRookie

A dynamic higher timeframe candle indicator that displays live-updating multi-timeframe candles directly on your current chart, revealing broader market structure in real-time.

Main price chart · unverifiedScalping · Day Trading
Explore
116likes1.9Kviews2comments
Save
TrendSignalOscillator

Hurst Exponent Oscillator [PhenLabs]

by PhenLabs

The Hurst Exponent Oscillator analyzes market behavior by measuring long-term memory in price series, distinguishing between trending, mean-reverting, and random market conditions for strategic trading decisions.

Separate pane · unverifiedScalping · Day Trading
Explore
69likes1.1Kviews2comments
Save
TrendVolatilitySignal

Volatility Layered Supertrend [NLR]

by NonLinearRookie

Volatility Layered Supertrend (VLS) is an advanced trend-following indicator that improves traditional Supertrend by providing clearer entry points, trend strength zones, and dynamic profit targets.

Main price chart · unverifiedScalping · Day Trading
Explore
42likes713views2comments
Save

Likes, views, and comments are historical TradingView snapshots. They describe attention, not trading performance.

START WITH A QUESTION

A little less searching.
A lot more understanding.

Tell DeepAlpha what you need. Get an explanation, a shortlist,
and a direct path to the indicators behind it.

Ask DeepAlpha