RS: Market Profile
A Market Profile indicator that visualizes price and volume distribution, highlighting key trading levels and providing insights into market structure through time-price opportunity (TPO) analysis.
Explore 11,183 indicators. Filter beyond the obvious.
Discover the tools that fit the way you trade.
11,183 tools to explore
A Market Profile indicator that visualizes price and volume distribution, highlighting key trading levels and providing insights into market structure through time-price opportunity (TPO) analysis.
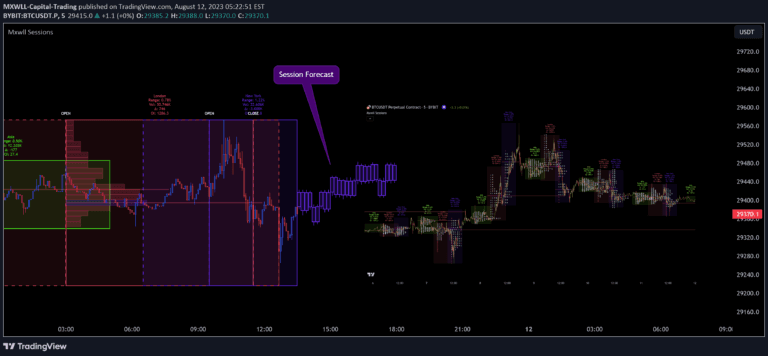
A comprehensive market session indicator that displays TPO profiles, market session times, volume delta, and price forecasts across different trading periods with advanced statistical analysis.
A Fibonacci-based trading signal using SMA bands to identify short-term reversals in market direction. Helps traders spot potential entry and exit points during ranging market conditions.
A Wyckoff Springs indicator identifies potential bullish reversal patterns by detecting price dips below support levels followed by quick rebounds, signaling a possible buying opportunity.
The ICT Unicorn Model is a technical trading strategy that identifies optimal market entry points by combining Breaker Blocks and Fair Value Gaps to signal potential trend reversals or continuations.
The Daily Standard Deviation indicator maps price movements using statistical analysis, revealing typical price ranges and potential reversal points by measuring price dispersion around a mean.
RMSD Trend is a volatility-weighted trend channel indicator that uses Root Mean Square Deviation to identify market momentum, offering dynamic insights into price movement and trend direction.
A trend detection indicator that calculates chart waves using ZigZag and identifies potential trend changes based on sequences of non-updated highs and lows.
AutoFibGauge is an advanced trading indicator that automatically plots Fibonacci retracement levels, confirms trends with moving averages, and provides a visual thermometer for quick market opportunity identification.
Entry Fragger is a cryptocurrency trading signal indicator that generates buy signals based on volume calculations and EMA positioning, helping traders identify potential price breakouts.
A technical analysis indicator that identifies potential breakout opportunities by combining price and volume conditions with EMA lines to detect market momentum and trend changes.
CANSLIM is an advanced stock screening strategy that evaluates companies across seven critical growth indicators to identify potentially high-performing stocks in the market.
Likes, views, and comments are historical TradingView snapshots. They describe attention, not trading performance.