Nick Rypock Trailing Reverse (NRTR)
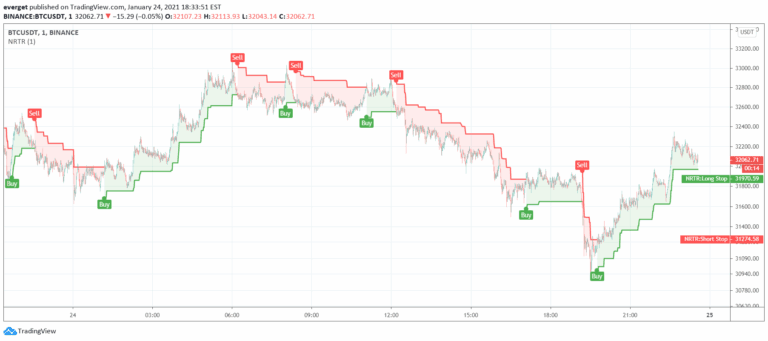
Nick Rypock Trend Reversal (NRTR) is a dynamic price channel indicator that tracks trend direction by measuring price extremes and percentage deviation from peak or bottom.
Explore 11,183 indicators. Filter beyond the obvious.
Discover the tools that fit the way you trade.
11,183 tools to explore
Nick Rypock Trend Reversal (NRTR) is a dynamic price channel indicator that tracks trend direction by measuring price extremes and percentage deviation from peak or bottom.
SuperBollingerTrend combines Bollinger Bands and SuperTrend to analyze market volatility and trend direction, providing traders insights into potential trend changes and breakouts.
A volume profile charting tool that visualizes trading volume distribution across price levels, detecting significant volume nodes and clusters for strategic trading insights.
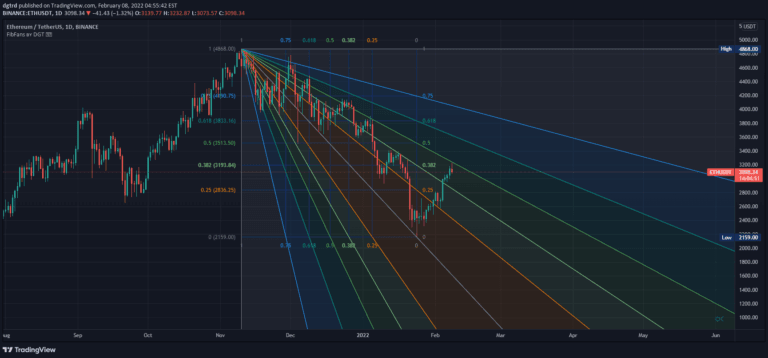
Fibonacci Speed and Resistance Fan is an analytical tool that identifies potential support and resistance levels by drawing lines based on Fibonacci percentages to predict trend changes and market movements.
Peak Activity Levels indicator identifies support and resistance zones using volume peaks, displaying price levels where significant trading activity occurs and highlighting potential market turning points.
A trading tool that visualizes candle bodies with the highest volume on a lower timeframe, highlighting areas of significant market activity using color-coded heatmaps and interval lines.
A scalping tool for 1-minute charts that filters trend direction and power to minimize false entries, focusing on identifying optimal trading opportunities in market movements.
A powerful volume profiling tool that analyzes trading volumes across price levels, revealing market activity, support/resistance zones, and potential price movement probabilities.
An advanced Smart Money Concept indicator that identifies swing high and low zones, helping traders determine premium and discount areas for optimal trade positioning and market structure analysis.
A refined Opening Range Breakout strategy that validates price breakouts using per-minute mean volume, focusing on identifying significant market movements during peak trading activity.
Volume Zones Internal Visualizer is an advanced candle type that reveals lower timeframe volume activity on a higher timeframe chart, highlighting volume zones and peak activity levels.
A trading signal combining Supertrend and Donchian channels to identify potential market reversals, designed for trend analysis across different timeframes with customizable sensitivity.
Likes, views, and comments are historical TradingView snapshots. They describe attention, not trading performance.