Global Liquidity Index
Global Liquidity Index tracks worldwide central bank balance sheets, providing a comprehensive view of global monetary conditions and potential market trends through consolidated financial data.
Explore 11,183 indicators. Filter beyond the obvious.
Discover the tools that fit the way you trade.
11,183 tools to explore
Global Liquidity Index tracks worldwide central bank balance sheets, providing a comprehensive view of global monetary conditions and potential market trends through consolidated financial data.
Global Monetary Supply M2 tracks the monetary volume of the world's richest and most populous countries, measuring currency liquidity in USD.
Monte Carlo Simulation is a predictive modeling technique that uses random sampling to generate multiple potential price paths and forecast market scenarios based on historical data.
Advanced machine learning trading tool using kernel regression to predict price targets and trends. Provides dynamic analysis with customizable settings for enhanced trading decision-making.
A comprehensive trading session indicator that tracks global market hours across multiple time zones, helping traders identify optimal trading windows and manage time-sensitive strategies.
World Clocks is a fun visualization tool that displays time across different global locations, providing real-time updates and synchronization with chart data.
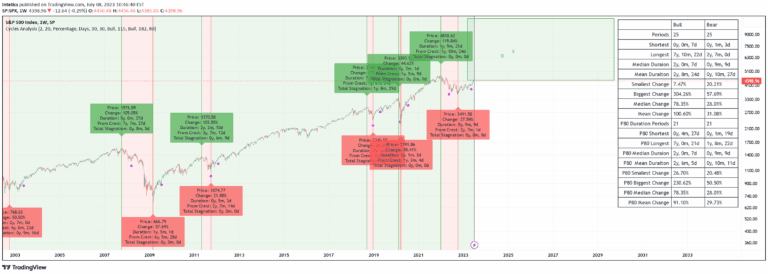
A market cycle analysis tool that visually represents bull and bear market phases, predicting potential future price movements by analyzing historical cycle patterns and durations.
A trading tool for planning trade entries and exits with customizable target prices, stop-loss functions, and risk management features for precise position calculation and trade strategy.
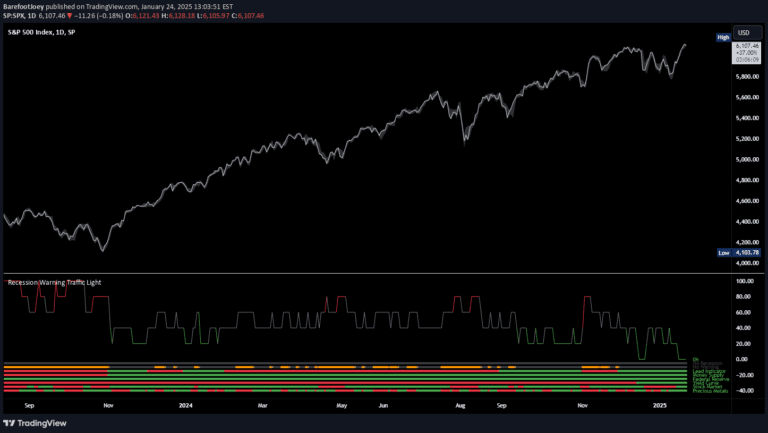
A multi-metric recession probability indicator using six key economic factors to assess potential economic downturns by analyzing various financial and market signals.
An advanced Bitcoin price prediction model using Stock-to-Flow ratio with nonlinear analysis, offering refined insights into cryptocurrency market dynamics and potential price movements.
A chart background color indicator that helps traders identify market trend direction by analyzing price, moving averages, and market breadth on daily charts.
A Pine Script tool that calculates stop loss and take profit levels using Average True Range, providing traders with dynamic risk management guidelines based on market volatility.
Likes, views, and comments are historical TradingView snapshots. They describe attention, not trading performance.