Elliott Wave [LuxAlgo]
Elliott Wave indicator automatically detects impulse and corrective wave patterns in price movements, helping traders identify potential trend directions and market phases.
Explore 11,183 indicators. Filter beyond the obvious.
Discover the tools that fit the way you trade.
11,183 tools to explore
Elliott Wave indicator automatically detects impulse and corrective wave patterns in price movements, helping traders identify potential trend directions and market phases.
A cumulative volume delta indicator that uses intrabar analysis to precisely track buying and selling pressure across different timeframes, revealing hidden volume dynamics within price bars.
A market structure analysis technique that identifies trend changes and pivotal points using Break of Structure (BOS) and Change of Character (CHOCH) concepts.
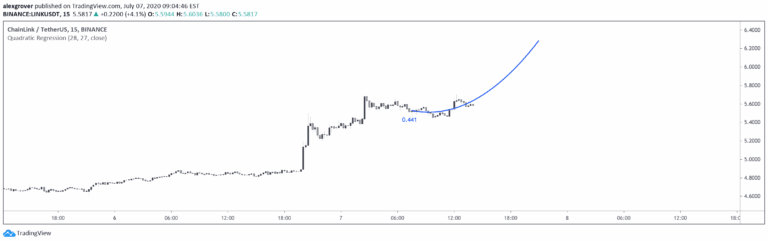
A quadratic regression indicator that fits a parabolic curve to price data, allowing traders to analyze non-linear trends and potentially forecast future price movements.
A trend-following system that uses volatility-scaled steps to track market momentum, visualizing trend progression through discrete channels and adaptive volatility bands.
TrendWave Bands is an adaptive trend-following indicator that uses dynamic color-gradient bands to highlight market trends, providing visual insights into trend direction, strength, and duration.
A dynamic trend-tracking indicator that identifies major trend shifts, maps price impulses, and quantifies trend strength through adaptive volatility envelopes and real-time percentage calculations.
A visual time-tracking tool that plots vertical lines marking trading weeks and days to help traders maintain a clearer perspective on time-related aspects across different chart timeframes.
Bitcoin Cycle Indicator tracks long-term market cycles, providing visual insights into potential tops and bottoms, and projecting future price targets for strategic Bitcoin investment.
A sophisticated trading indicator using Square of Nine methodology to forecast potential support and resistance levels by analyzing market pivots and price progression across geometric angles.
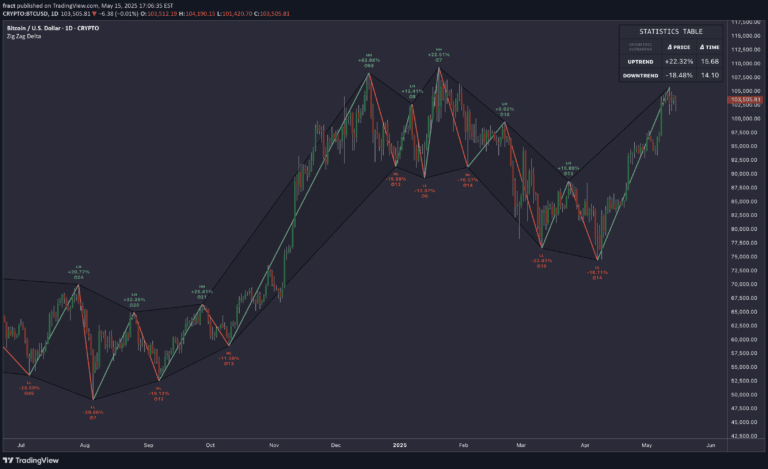
A sophisticated trend analysis tool that automatically detects market swing points, visualizes trend dynamics, and provides real-time statistical insights into price movements and trend characteristics.
A market structure indicator that identifies trend direction by tracking higher highs, higher lows, lower highs, and lower lows through swing point analysis and ZigZag methodology.
Likes, views, and comments are historical TradingView snapshots. They describe attention, not trading performance.