Stablecoin Supply Ratio [Alpha Extract]
The Stablecoin Supply Ratio (SSR) indicator measures Bitcoin's market capitalization relative to stablecoin liquidity, providing insights into potential market capital flows and sentiment shifts.
Explore 11,183 indicators. Filter beyond the obvious.
Discover the tools that fit the way you trade.
11,183 tools to explore
The Stablecoin Supply Ratio (SSR) indicator measures Bitcoin's market capitalization relative to stablecoin liquidity, providing insights into potential market capital flows and sentiment shifts.
A comprehensive economic indicator combining OECD Composite Leading Indicator and ISM Purchasing Managers' Index to assess US economic trends and potential market corrections.
A comprehensive technical analysis tool combining RSI, EMA lines, and past trend to generate actionable trading signals and provide insights into market strength and potential opportunities.
The Purchasing Managers Index (PMI) is an economic indicator that assesses manufacturing and services sector health through surveys of purchasing managers' perceptions and expectations.
An options trading indicator that helps traders identify optimal straddle and strangle strategies by analyzing option greeks and calculating strategic strike prices based on market conditions.
An advanced FX forecasting tool that uses macroeconomic analysis to predict exchange rate movements by combining multiple predictive models and statistical techniques.
Federal Reserve's monetary policy strategy of expanding or reducing balance sheet through buying or selling securities to manage economic conditions and market liquidity.
A comparative indicator tracking the relationship between NIFTY and Gold prices, revealing relative economic valuation and potential investment opportunities across different asset classes.
A TradingView script that adjusts Bitcoin's price for inflation, revealing its true purchasing power and value over time by comparing nominal and inflation-adjusted prices.
An inflation-adjusted price indicator that reveals the real value of an asset by comparing its current price to its historical purchasing power.
An inflation-adjusted chart revealing the true purchasing power of an asset by comparing nominal price against inflation-corrected value over time.
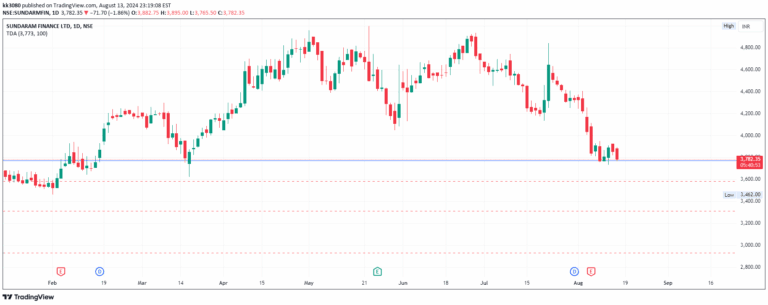
Triple Dip Averaging (TDA) is a strategic investment tool that helps investors systematically reduce their average cost basis by purchasing additional shares at predetermined price drop levels.
Likes, views, and comments are historical TradingView snapshots. They describe attention, not trading performance.