YOUR INDICATOR RESEARCH STARTS HERE

Find the right indicator.
Understand what it does.

Explore 11,183 indicators. Filter beyond the obvious.
Discover the tools that fit the way you trade.

THE INDICATOR LIBRARY

Results for “repaint”

11,183 tools to explore

33 indicators matching your filters
Save search
TrendMomentumEditor’s pick

Bjorgum Double Tap

by Bjorgum

Double Tap is a pattern recognition strategy that identifies double top and double bottom formations, providing entry signals based on price action reversals and breakout patterns.

Main price chart · unverifiedDay Trading · Swing Trading
Explore
7.1Klikes159.9Kviews73comments
Save
MomentumOscillatorSignal

Edri Extreme Points Buy & Sell

by spudow

A trading indicator that combines CCI/Momentum and RSI to identify potential market reversals by detecting extreme price points and momentum shifts.

Separate pane · unverifiedScalping · Day Trading
Explore
2.8Klikes65.8Kviews55comments
Save
LevelsVolume

Volume Profile Matrix [LuxAlgo]

by LuxAlgo

A volume profile matrix indicator that calculates trading activity across a grid of intervals, revealing liquidity and high-volume price levels using color-coded cells.

Main price chart · unverifiedScalping · Day Trading
Explore
2.4Klikes79.1Kviews10comments
Save
TrendVolatilityChannels

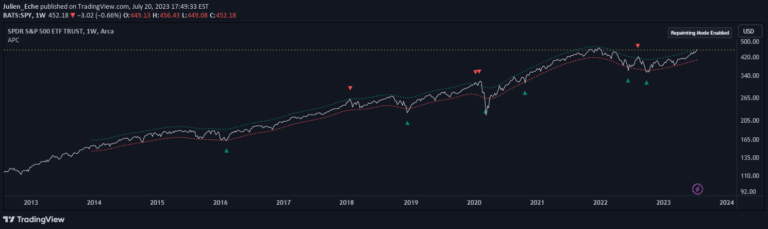
Adaptive Price Channel (log scale)

by Julien_Eche

An adaptive trading indicator using logarithmic price scaling and Nadaraya-Watson estimation to create dynamic price channels that adjust to market conditions and provide potential trading signals.

Main price chart · unverifiedScalping · Day Trading
Explore
797likes16Kviews4comments
Save
TrendMomentumEditor’s pick

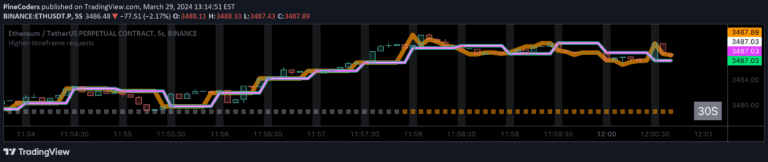
Higher-timeframe requests

by PineCoders

A comprehensive guide to accessing higher-timeframe data using request.security() function while preventing repainting, offering multiple non-repainting techniques for more reliable trading signals.

Main price chart · unverifiedDay Trading · Swing Trading
Explore
770likes51.3Kviews14comments
Save

Likes, views, and comments are historical TradingView snapshots. They describe attention, not trading performance.

START WITH A QUESTION

A little less searching.
A lot more understanding.

Tell DeepAlpha what you need. Get an explanation, a shortlist,
and a direct path to the indicators behind it.

Ask DeepAlpha