MadTrend [InvestorUnknown]
MadTrend is an advanced trading indicator using median and median absolute deviation to generate trend signals and identify market risk states with nuanced insights.
Explore 11,183 indicators. Filter beyond the obvious.
Discover the tools that fit the way you trade.
11,183 tools to explore
MadTrend is an advanced trading indicator using median and median absolute deviation to generate trend signals and identify market risk states with nuanced insights.
A trend pivot indicator that identifies potential market reversals by analyzing price movements through higher highs/lows and lower highs/lows with customizable pivot and confirmation parameters.
A multi-purpose trading indicator that compares cryptocurrency performance against DXY, using advanced statistical models to assess relative strength and potential market movements.
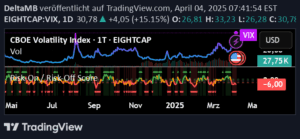
A technical analysis tool that measures market sentiment by comparing risk-on and risk-off assets using Williams %R, helping traders understand market conditions and potential trend directions.
A comprehensive risk sentiment indicator that measures market psychology by integrating multiple cross-asset components to assess investors' collective risk appetite and market conditions.
Market Breadth indicator tracking the percentage of S&P 500 stocks above their 200-day moving average, using EMAs to visualize market strength and potential trend reversals.
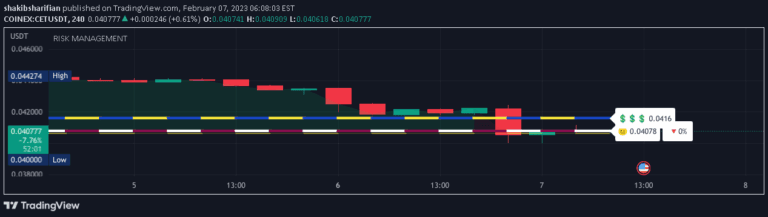
A risk management trading tool that helps traders analyze entry points, track potential profits, and manage trade exits based on predefined price and volume parameters.
A macro-based tool tracking capital flows across multiple assets to generate a normalized risk sentiment score, helping traders understand market dynamics and potential directional bias.
A macro sentiment indicator that calculates risk appetite by analyzing 14 financial assets across risk-on, risk-off, and relative spread categories to assess overall market conditions.
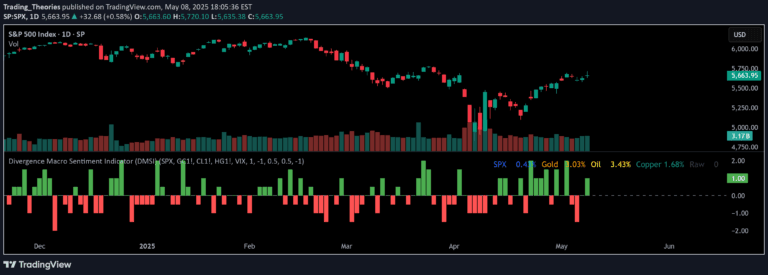
The Divergence Macro Sentiment Indicator (DMSI) reveals market sentiment by tracking the relationship between growth assets and safe havens in a single histogram.
An inverted USDT Dominance indicator that visually reveals market sentiment by flipping the typical USDT Dominance chart, helping traders understand risk appetite and market dynamics.
Likes, views, and comments are historical TradingView snapshots. They describe attention, not trading performance.