Smart Money Concepts Probability (Expo)
A trading indicator tracking institutional investor actions by calculating probabilities of market structure changes and order flow direction for strategic trading decisions.
Explore 11,183 indicators. Filter beyond the obvious.
Discover the tools that fit the way you trade.
11,183 tools to explore
A trading indicator tracking institutional investor actions by calculating probabilities of market structure changes and order flow direction for strategic trading decisions.
A technical analysis indicator that identifies three-bar reversal patterns, helping traders detect potential trend changes by analyzing consecutive price bar formations and their relationships.
A multi-timeframe support and resistance indicator that identifies key price zones, tracks breaks and retests, and provides comprehensive market trend analysis for traders.
A customizable moving average indicator that combines trend analysis with mean reversion detection, offering dynamic candle coloring and an oscillator to identify potential price shifts.
A market structure indicator that identifies trend reversals and continuations by tracking protected highs and lows, helping traders recognize significant price movement shifts.
An advanced trading indicator implementing the ICT Turtle Soup strategy, which identifies liquidity zones and market structure shifts to generate precise entry and exit signals for traders.
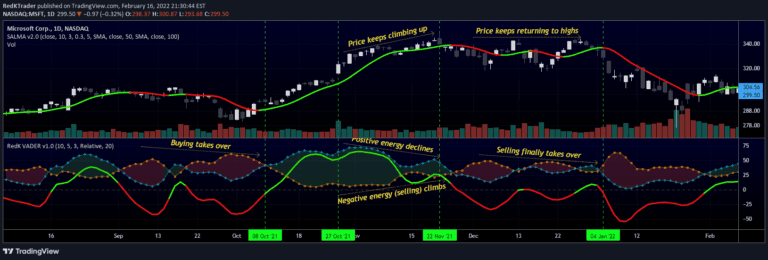
VADER is a volume-based technical indicator that measures market energy by analyzing price displacement and trading volume to determine bullish or bearish market sentiment.
ICT Algorithmic Macro Tracker plots key trading time windows based on Inner Circle Trader methodology, helping traders identify potential market movement periods across specific time intervals.
A market structure indicator that detects breaker blocks, extending swing levels and highlighting potential support/resistance zones through price interactions and breakout events.
A trading indicator that calculates average Fair Value Gap (FVG) initiation levels to identify potential support and resistance zones based on significant market participant positioning.
A candlestick analysis indicator designed to identify potential market reversals by detecting distinctive candle patterns that suggest significant price direction changes.
A momentum indicator that uses Hull Moving Average to track price shifts, creating dynamic five-level zones that highlight momentum strength and potential trend changes.
Likes, views, and comments are historical TradingView snapshots. They describe attention, not trading performance.