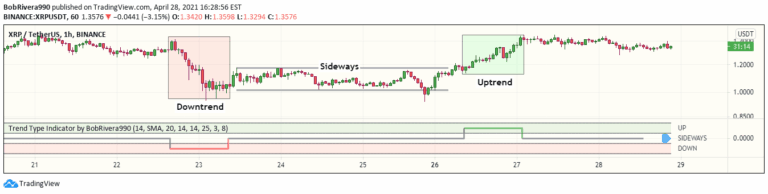
Trend Type Indicator by BobRivera990
A technical analysis signal that uses ATR and ADX to detect market trends, distinguishing between uptrend, downtrend, and sideways movements by analyzing price volatility and directional momentum.
Explore 11,183 indicators. Filter beyond the obvious.
Discover the tools that fit the way you trade.
11,183 tools to explore
A technical analysis signal that uses ATR and ADX to detect market trends, distinguishing between uptrend, downtrend, and sideways movements by analyzing price volatility and directional momentum.
A charting tool that measures traded volume and money flow across price levels, revealing trading activity, sentiment, and key market levels for strategic analysis.
A trading indicator that identifies swing point tests and retests, highlighting potential breakout areas with color-coded zones and triangular markers to signal market movement.
A sophisticated charting tool that analyzes price and volume data to reveal market sentiment, liquidity distribution, and significant trading levels across different market conditions.
An advanced charting tool measuring liquidity and market sentiment by analyzing price and volume data across different anchoring periods to reveal significant trading levels.
A price action scalping sequence identifying potential breakout opportunities by detecting two unsuccessful breakouts in the same direction, anticipating a third decisive move.
A volume profile indicator that visualizes trading volume across different time frames using lines and boxes, providing unique insights into volume distribution and market activity.
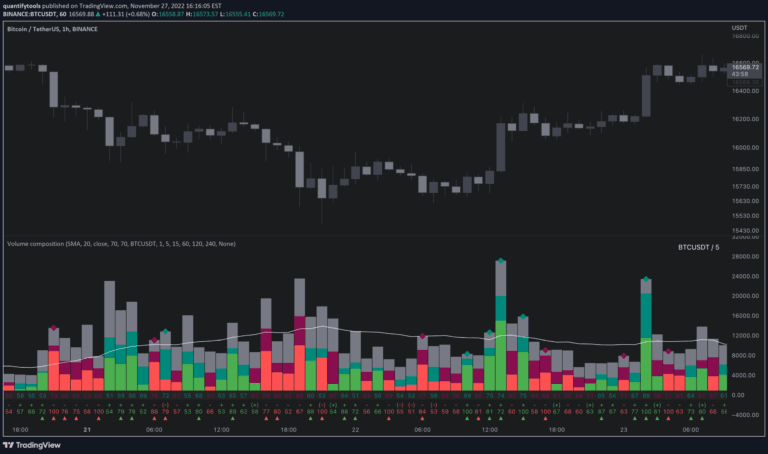
Volume composition indicator that breaks down trading volume into buy, sell, passive, and active components to provide deeper insights into market liquidity and potential price movements.
A live footprint indicator showing bid/ask volume and delta at price levels, providing real-time trading volume insights with two distinct visualization modes.
Advanced volume profile indicator that analyzes market order flow, helping traders understand buying and selling pressure across different timeframes using customizable visualization modes.
A dynamic volume indicator that breaks down buy and sell volume proportions within each candle, showing real-time volume distribution and highlighting which side dominates trading activity.
An algorithmic tool that generates target levels based on market structure shifts and breaks, helping traders identify potential take profit, entry, and reversal points.
Likes, views, and comments are historical TradingView snapshots. They describe attention, not trading performance.