YOUR INDICATOR RESEARCH STARTS HERE

Find the right indicator.
Understand what it does.

Explore 11,183 indicators. Filter beyond the obvious.
Discover the tools that fit the way you trade.

THE INDICATOR LIBRARY

Results for “since”

11,183 tools to explore

54 indicators matching your filters
Save search
LevelsSignalTrend

DTFX Algo Zones [LuxAlgo]

by LuxAlgo

Auto-generated Fibonacci Retracements that identify market structure shifts and potential support/resistance zones based on technical breaks and price action dynamics.

Main price chart · unverifiedScalping · Day Trading
Explore
9.4Klikes142Kviews67comments
Save
OscillatorSignalTrend

Aroon Oscillator [BigBeluga]

by BigBeluga

The Aroon Oscillator with Mean Reversion is a versatile trading tool that tracks trend strength and potential reversals by measuring price momentum and identifying potential trend changes.

Separate pane · unverifiedScalping · Day Trading
Explore
1.8Klikes26.7Kviews15comments
Save
VolumeTrendEditor’s pick

Short Volume Stamper

by KioseffTrading

A trading signal that analyzes short volume, total volume, and short volume ratio since the 2-year high price, providing insights into market sentiment and potential trend shifts.

Separate pane · unverifiedSwing Trading
Explore
1.2Klikes47.7Kviews18comments
Save
TrendMomentumOscillator

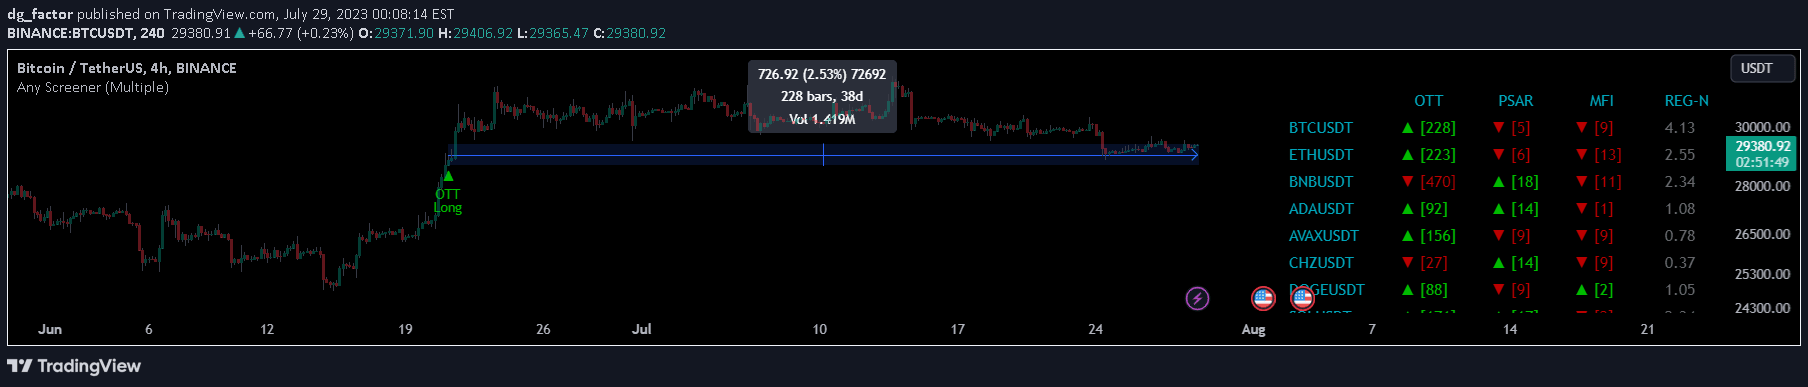
Any Screener (Multiple)

by dg_factor

An advanced multi-indicator screener that analyzes market signals across multiple symbols, providing trend direction, signal status, and detailed insights for trading decisions.

Separate pane · unverifiedScalping · Day Trading
Explore
913likes17.8Kviews24comments
Save
MomentumOscillatorSignal

RSI Divergence Screener by zdmre

by zdmre

An RSI Divergence Scanner that tracks bullish and bearish signals across multiple assets, identifying potential trend reversals by comparing price action to RSI momentum.

Separate pane · unverifiedScalping · Day Trading
Explore
777likes17.1Kviews14comments
Save
ChannelsLevelsTrend

True Trend Average Bands

by koryu

A dynamic moving average that calculates the real average price since a trend started, adapting to significant market trends and providing insights into price movement across multiple timeframes.

Main price chart · unverifiedScalping · Day Trading
Explore
432likes12.3Kviews13comments
Save
LevelsSignalTrend

Percentage Based ZigZag

by Botnet101

A dynamic ZigZag indicator that identifies significant price reversals using percentage-based thresholds, helping traders filter market noise and detect meaningful trend shifts.

Main price chart · unverifiedScalping · Day Trading
Explore
403likes8Kviews6comments
Save
LevelsSignalTrend

Pivot Market Structure

by Daniel_Ge

A technical analysis script that identifies market structure levels using price action trails and pivot points to track trends and potential reversal zones.

Main price chart · unverifiedScalping · Day Trading
Explore
307likes6.2Kviews6comments
Save
TrendLevels

BTC Log High/Low Chart

by okor96

A logarithmic price indicator for Bitcoin that calculates and plots high and low prices using a specialized mathematical formula based on historical timestamp data.

Main price chart · unverifiedDay Trading · Swing Trading
Explore
272likes4Kviews2comments
Save

Likes, views, and comments are historical TradingView snapshots. They describe attention, not trading performance.

START WITH A QUESTION

A little less searching.
A lot more understanding.

Tell DeepAlpha what you need. Get an explanation, a shortlist,
and a direct path to the indicators behind it.

Ask DeepAlpha