YOUR INDICATOR RESEARCH STARTS HERE

Find the right indicator.
Understand what it does.

Explore 11,183 indicators. Filter beyond the obvious.
Discover the tools that fit the way you trade.

THE INDICATOR LIBRARY

Results for “stacked”

11,183 tools to explore

20 indicators matching your filters
Save search
MomentumEditor’s pick

Stochastic Heat Map

by Violent

A multi-timeframe stochastic oscillator system using 28 different stochastic lengths to analyze market momentum and generate trading signals through color-coded visualization.

Separate pane · unverifiedSwing Trading
Explore
4.2Klikes121.6Kviews87comments
Save
MomentumSignalTrend

Red Pill VWAP/RSI Divergence

by Morpheus835

A trading signal identifying divergence between VWAP and RSI, providing potential entry points during strong bullish or bearish trends by analyzing price pullbacks relative to moving averages.

Main price chart · unverifiedScalping · Day Trading
Explore
1.2Klikes19.2Kviews9comments
Save
TrendVolatility

Weekly Stacked Daily Changes [LuxAlgo]

by LuxAlgo

A visualization tool that stacks daily price changes by week, allowing traders to quickly analyze daily and weekly price movement patterns and volatility across different timeframes.

Separate pane · unverifiedDay Trading · Swing Trading
Explore
790likes14.6Kviews4comments
Save
MomentumOscillator

Any Oscillator Underlay [TTF]

by TheTrdFloor

A comprehensive multi-oscillator indicator combining 8 different technical analysis tools into a single, customizable panel for enhanced trading insights and strategy development.

Separate pane · unverifiedScalping · Day Trading
Explore
754likes13.5Kviews2comments
Save
VolumeTrendEditor’s pick

Zigzag Volume Bars

by Trendoscope

A trading indicator for visualizing volume data on Zigzag swing highs and lows with multiple display options that help traders analyze market movements and volume trends.

Separate pane · unverifiedSwing Trading
Explore
594likes42.9Kviews32comments
Save
VolumeEditor’s pick

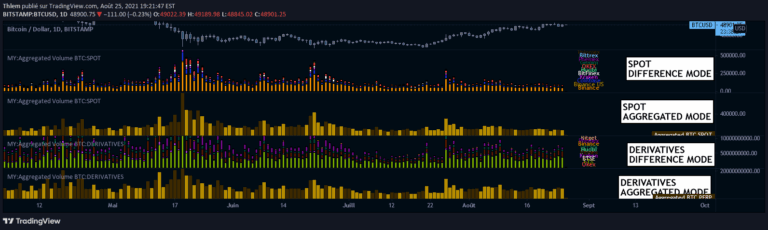
MY:Aggregated Volume BTC:SPOT

by Thlem

A comprehensive Bitcoin trading volume indicator that aggregates volume data across multiple exchanges, helping traders understand market buying pressure and volume distribution in spot markets.

Separate pane · unverifiedDay Trading · Swing Trading
Explore
401likes17.3Kviews12comments
Save
SignalVolume

GLOBAL LIQUIDITY (Simple Proxy)

by pipesupertramp

A global liquidity indicator that provides multiple visualization options for central bank data, enabling traders to analyze monetary trends and changes across different financial landscapes.

Separate pane · unverifiedDay Trading · Swing Trading
Explore
192likes7.7Kviews0comments
Save
SignalTrend

EMA orderly stacked or not

by Tuxen

A visual indicator that plots colored circles on a chart to show the stacking order of multiple exponential moving averages, helping traders quickly assess market trend alignment.

Main price chart · unverifiedScalping · Day Trading
Explore
106likes4.1Kviews0comments
Save
OscillatorSignal

Wave Modulation Demo

by kaigouthro

A multi-wave modulation script demonstrating complex wave interactions by stacking and dynamically modifying wave characteristics through frequency, amplitude, and phase transformations.

Main price chart · unverifiedScalping · Day Trading
Explore
102likes1.8Kviews2comments
Save

Likes, views, and comments are historical TradingView snapshots. They describe attention, not trading performance.

START WITH A QUESTION

A little less searching.
A lot more understanding.

Tell DeepAlpha what you need. Get an explanation, a shortlist,
and a direct path to the indicators behind it.

Ask DeepAlpha