Stochastic Heat Map
A multi-timeframe stochastic oscillator system using 28 different stochastic lengths to analyze market momentum and generate trading signals through color-coded visualization.
Explore 11,183 indicators. Filter beyond the obvious.
Discover the tools that fit the way you trade.
11,183 tools to explore
A multi-timeframe stochastic oscillator system using 28 different stochastic lengths to analyze market momentum and generate trading signals through color-coded visualization.
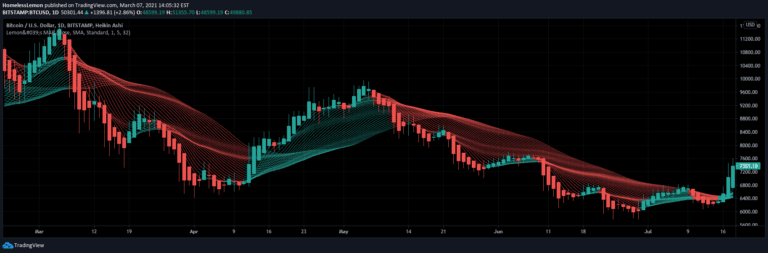
A customizable moving average ribbon indicator that helps traders analyze trend strength and direction by plotting multiple moving averages with adjustable parameters and visual themes.
The Gaps Profile indicator tracks and visualizes price gaps, showing remaining market inefficiencies and potential supply/demand zones across different timeframes and trading styles.
A comprehensive multi-symbol screener tracking RSI and Stochastic indicators across 17 symbols, helping traders identify overbought and oversold conditions with customizable thresholds.
A unique crypto narrative strength indicator that aggregates RSI values across multiple tokens to assess momentum and sentiment in different cryptocurrency themes.
VWAP Vision is a comprehensive trading indicator that uses Volume-Weighted Average Price with customizable bands and themes to generate buy/sell signals and analyze market trends.
A festive TradingView indicator that adds playful snowflake labels to the chart, designed to bring holiday cheer while exploring chart visualization capabilities.
A customizable sticky note tool for traders to create reminders, checklists, and strategy notes with flexible formatting options across different themes.
A comprehensive volume analysis tool that displays daily and monthly trading volume statistics, offering insights into market sentiment and volume distribution across the year.
A custom chart theming indicator offering multiple pre-defined color schemes and visual styles to enhance chart readability and personalize trading interface aesthetics.
A multi-length moving average indicator with color-coded gradient themes that helps traders quickly visualize trend direction, support/resistance levels, and potential market reversals.
A TradingView indicator that transforms candlestick colors using multiple pre-defined visual themes, enhancing chart aesthetics and personalizing trading visualization.
Likes, views, and comments are historical TradingView snapshots. They describe attention, not trading performance.