Ichimoku Theories [LuxAlgo]
A comprehensive Ichimoku trading tool that combines multiple theories to analyze market trends, cycles, waves, and potential price targets using advanced Japanese technical analysis techniques.
Explore 11,183 indicators. Filter beyond the obvious.
Discover the tools that fit the way you trade.
11,183 tools to explore
A comprehensive Ichimoku trading tool that combines multiple theories to analyze market trends, cycles, waves, and potential price targets using advanced Japanese technical analysis techniques.
A dynamic tool that analyzes potential liquidation points in trading, measuring market momentum, identifying trader positioning, and highlighting potential reversal zones.
A sophisticated trading indicator using Bayesian probability theory and multiple moving averages to assess market trends and predict potential price direction with statistical precision.
Advanced candlestick pattern recognition system that identifies 85 unique patterns across one to five candle formations, analyzing their statistical performance and potential market implications.
A unique trading indicator using Candle Range Theory to analyze market movements through candlestick size and structure, offering flexible entry methods with dynamic risk management.
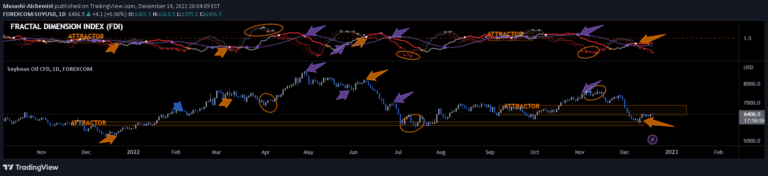
Musashi Fractal Dimension Index (FDI) measures market behavior using fractal theory, revealing market persistence, trend potential, and price movement characteristics.
Advanced multi-timeframe Zigzag indicator offering recursive wave analysis and pattern recognition across different market timeframes with customizable visualization and tracking capabilities.
SMT Divergence identifies potential market reversals by comparing price behaviors between two correlated assets, revealing subtle signs of market manipulation and trend shifts.
AMDX strategy divides the trading day into four distinct phases, providing a structured approach to understanding market behavior and institutional trading patterns.
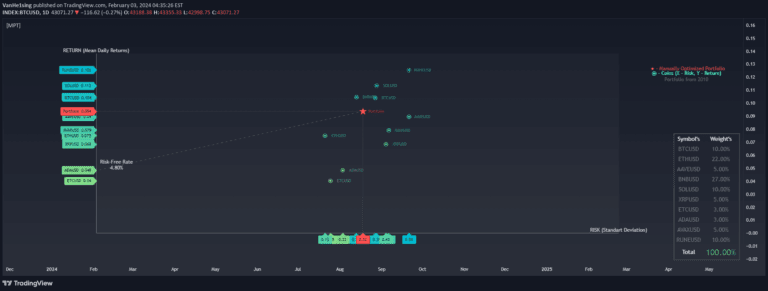
A Modern Portfolio Theory tool that helps traders optimize investment allocations by analyzing risk and return across multiple assets using a comprehensive scatter plot visualization.
A powerful TradingView indicator using ZigZag algorithm and Dow Theory to detect price pivots, support/resistance levels, and market structure with visual clarity.
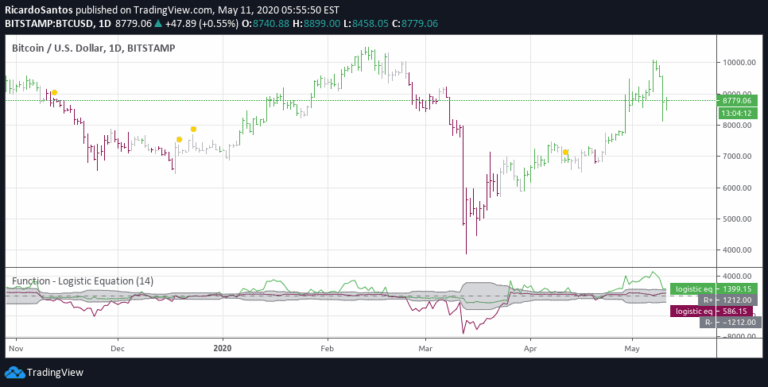
An experimental trading approach exploring the logistic equation's potential correlation with market dynamics, suggesting mathematical patterns might predict or explain market behavior.
Likes, views, and comments are historical TradingView snapshots. They describe attention, not trading performance.