Machine Learning Adaptive SuperTrend [AlgoAlpha]
A machine learning-powered SuperTrend indicator that uses k-means clustering to dynamically adapt to market volatility, providing intelligent trend identification and volatility insights.
Explore 11,183 indicators. Filter beyond the obvious.
Discover the tools that fit the way you trade.
11,183 tools to explore
A machine learning-powered SuperTrend indicator that uses k-means clustering to dynamically adapt to market volatility, providing intelligent trend identification and volatility insights.
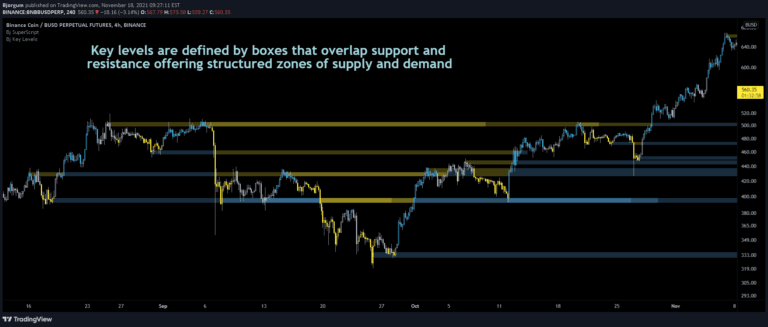
Key Levels strategy identifies critical price action points like breakouts, false breakouts, and backchecks to help traders understand market movement and potential trading opportunities.
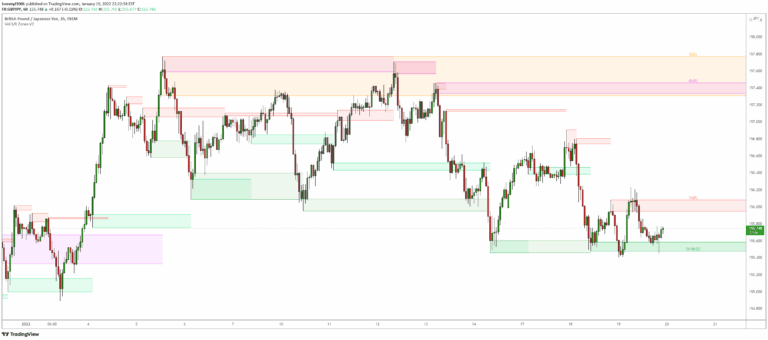
An advanced Support & Resistance indicator that identifies significant price zones using volume and fractal highs/lows, helping traders visualize potential trend reversals and continuations.
PMax Explorer is a trading strategy that combines moving stop loss and SuperTrend indicators to generate reliable buy and sell signals for trend identification and potential reversals.
Elliott Wave indicator automatically detects impulse and corrective wave patterns in price movements, helping traders identify potential trend directions and market phases.
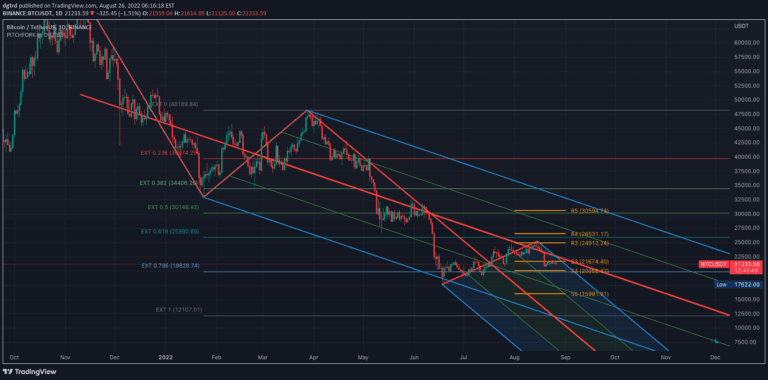
Pitchfork is a technical indicator that helps traders identify potential support and resistance levels by drawing trend lines based on three strategic points in price movement.
An advanced trading indicator that identifies potential Fair Value Gaps during specific one-hour market sessions and highlights support/resistance levels for strategic entry and exit points.
A dynamic indicator that identifies potential liquidity pools by tracking price interactions with specific zones, helping traders anticipate market movements and institutional trading strategies.
A footprint bar indicator that visualizes volume or open interest data within the chart's visible range, offering three different heatmap styles to analyze trading activity.
A technical analysis indicator that identifies three-bar reversal patterns, helping traders detect potential trend changes by analyzing consecutive price bar formations and their relationships.
A multi-timeframe support and resistance indicator that identifies key price zones, tracks breaks and retests, and provides comprehensive market trend analysis for traders.
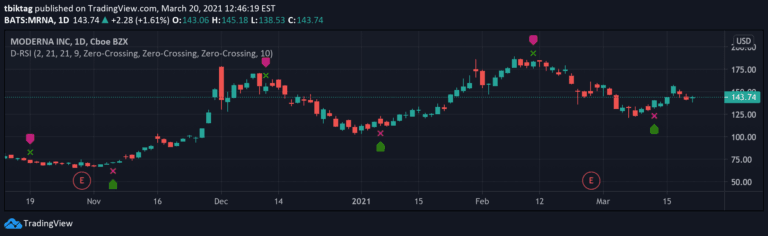
Delta-RSI Oscillator is a momentum indicator that measures the rate of change in RSI through a smoothed time derivative, providing dynamic insights into market momentum shifts.
Likes, views, and comments are historical TradingView snapshots. They describe attention, not trading performance.