Tick Chart
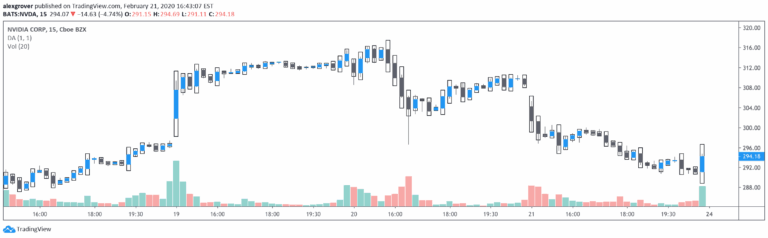
Tick Chart is a unique charting method that creates candlesticks based on a specific number of price ticks, offering an alternative to time-based charts for analyzing market movements.
Explore 11,183 indicators. Filter beyond the obvious.
Discover the tools that fit the way you trade.
11,183 tools to explore
Tick Chart is a unique charting method that creates candlesticks based on a specific number of price ticks, offering an alternative to time-based charts for analyzing market movements.
A tick data analysis tool that breaks down trading volume into different levels, revealing trading activity from different market participant types and detecting potential volume anomalies.
A real-time volume delta and tick indicator providing detailed insights into market dynamics by analyzing live trading updates, focusing on price action and volume information at small timeframes.
Volume Delta is an advanced indicator that analyzes trading volumes, revealing buy-sell activities and market momentum through color-coded candlestick visualizations.
A trading tool that predicts market movements by analyzing historical candlestick colors and patterns, projecting future price action based on similar past events.
Advanced candlestick analysis tool that identifies market reversals and trend changes using multiple pattern detection and dynamic trend filtering techniques.
A novel indicator that highlights trending and ranging intrabar candles, providing signals when price breaks specific candle extremities across different trading modes.
Deep Volume provides high-fidelity volume analysis using real-time Tradingview data, offering detailed insights into market dynamics through comprehensive volume metrics and visualization.
Order Chain is a live tick volume indicator that tracks real-time order flow dynamics, recording volume delta and order sizes at specific price levels to provide insights into market buying and selling pressure.
LTF Candle Insights offers a dual-view trading indicator that overlays lower timeframe candles onto the current chart, enabling detailed market trend and price level analysis.
A comprehensive candlestick pattern recognition tool that identifies five key trading patterns to help predict potential price movements and trend reversals in financial markets.
Dekidaka-Ashi is a unique candlestick visualization tool that integrates volume data with price action, creating enhanced candlesticks that reveal trading activity and potential market movements.
Likes, views, and comments are historical TradingView snapshots. They describe attention, not trading performance.