Support and Resistance (MTF) | Flux Charts
A multi-timeframe support and resistance indicator that identifies key price zones, tracks breaks and retests, and provides comprehensive market trend analysis for traders.
Explore 11,183 indicators. Filter beyond the obvious.
Discover the tools that fit the way you trade.
11,183 tools to explore
A multi-timeframe support and resistance indicator that identifies key price zones, tracks breaks and retests, and provides comprehensive market trend analysis for traders.
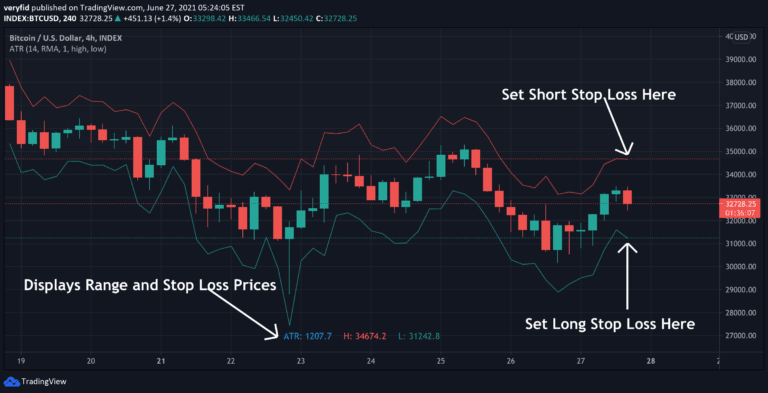
An ATR-based indicator that helps traders set adaptive stop losses by calculating safe exit points using volatility measurement. Prevents premature stop-outs and provides dynamic risk management.
A trading script that identifies breakout and retest signals by analyzing pivot points, highlighting key price levels with dynamic boxes and volume confirmation.
A customizable higher time-frame OHLC indicator that provides flexible visual references across multiple resolutions with advanced input options and alert conditions.
A grid trading strategy using martingale position sizing that doubles position size after losses, aiming to recover from previous trades by increasing exposure with each unsuccessful trade.
A momentum bias indicator that assesses market trend direction by calculating positive and negative momentum strengths, helping traders identify trend bias and potential entry/exit points.
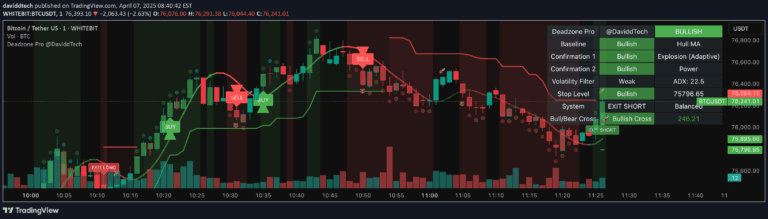
Deadzone Pro is an adaptive multi-strategy trading system using advanced trend detection, dual confirmation indicators, and dynamic risk management for precise market entries and exits.
A noise-reduction trading indicator based on Heikin-Ashi candlesticks with multiple averaging modes to help identify trend changes and market dynamics.
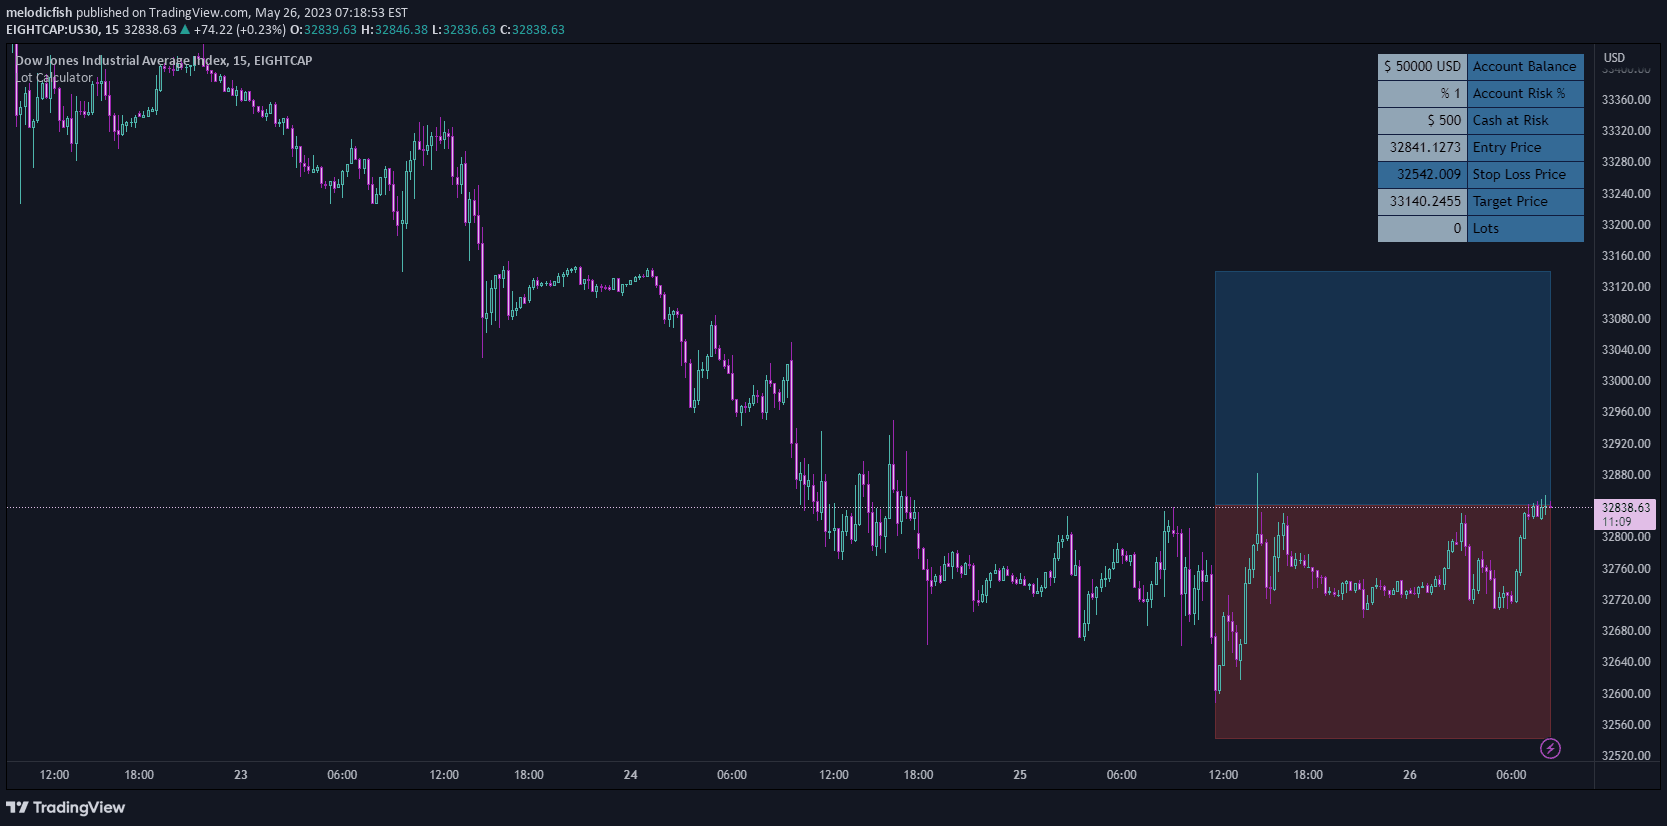
A versatile lot size calculator that helps traders manage risk by dynamically calculating position sizes based on entry, stop levels, account risk, and trading instrument.
Linear Regression Intensity is an advanced trend analysis tool that measures market trend strength using linear regression, offering dynamic color-coded insights into bullish, bearish, and neutral market conditions.
A trading script that combines MACD and RSI to detect bullish and bearish signals, providing traders with automated entry and exit points based on momentum and trend strength.
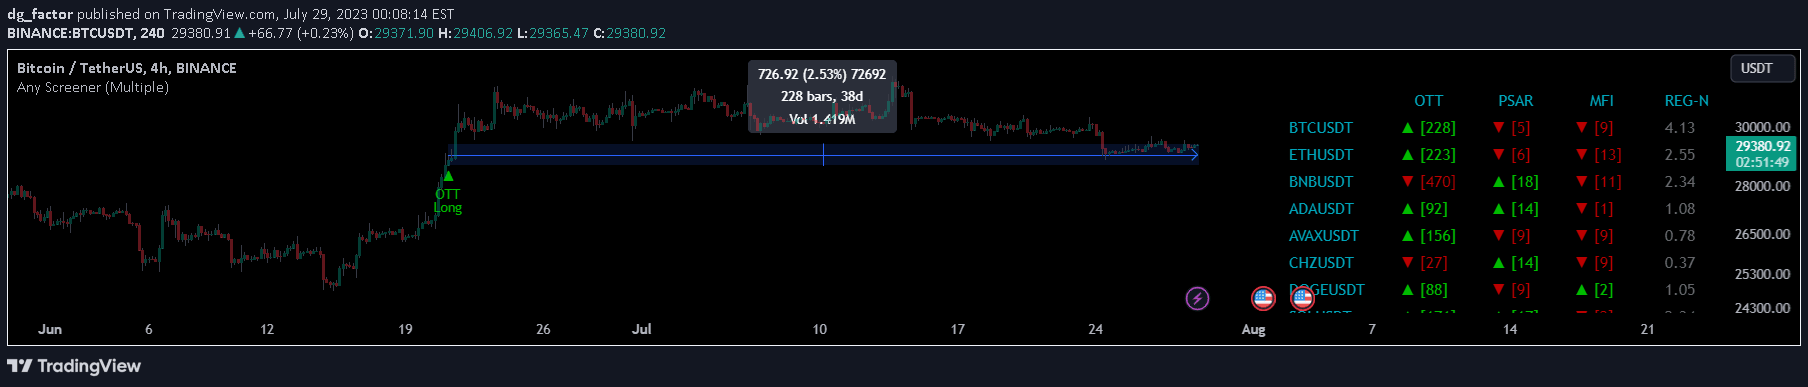
An advanced multi-indicator screener that analyzes market signals across multiple symbols, providing trend direction, signal status, and detailed insights for trading decisions.
Likes, views, and comments are historical TradingView snapshots. They describe attention, not trading performance.