Global Liquidity Index
Global Liquidity Index tracks worldwide central bank balance sheets, providing a comprehensive view of global monetary conditions and potential market trends through consolidated financial data.
Explore 11,183 indicators. Filter beyond the obvious.
Discover the tools that fit the way you trade.
11,183 tools to explore
Global Liquidity Index tracks worldwide central bank balance sheets, providing a comprehensive view of global monetary conditions and potential market trends through consolidated financial data.
Global Net Liquidity tracks total central bank assets across major economies, providing a comprehensive view of monetary conditions and potential market impacts.
Global Liquidity Index tracks central bank balance sheets worldwide, converting values to USD to provide a comprehensive view of global economic liquidity and monetary conditions.
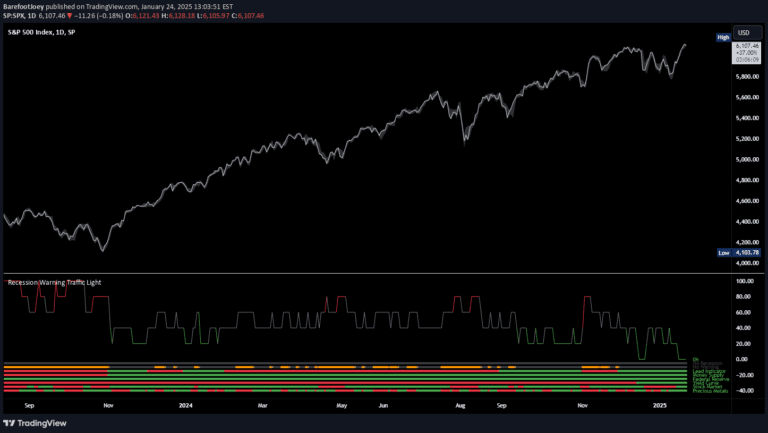
A multi-metric recession probability indicator using six key economic factors to assess potential economic downturns by analyzing various financial and market signals.
Tracks the combined balance sheets of major global central banks in USD, providing a comprehensive view of global monetary policy and liquidity conditions.
An advanced liquidity indicator tracking total USD market liquidity using Fed balance sheet data, correlating with risk asset performance and market dynamics.
A yield curve indicator tracking the percentage of Treasury Bond yield spreads that are inverted, providing insights into potential economic downturns and market sentiment.
Analyzes total USD market liquidity using Federal Reserve and Treasury account balances to track potential market movements and risk asset correlations.
Global Net Liquidity tracks worldwide central bank assets and liquidity, providing insights into market trends through a color-coded moving average cloud indicator.
US Net Liquidity tracks economic liquidity by analyzing Federal Reserve, Treasury, and financial market data to provide comprehensive insights into monetary conditions.
A composite z-score indicator using credit spreads and volatility indexes to assess market conditions and generate trading signals based on real-time market data.
Treasury Yields Heatmap is a dynamic tool tracking bond values and yield curve status across different countries using Pearson's linear regression coefficient.
Likes, views, and comments are historical TradingView snapshots. They describe attention, not trading performance.