Bitcoin Rainbow Wave
A comprehensive Bitcoin trading model that combines power law trend, rainbow chart, and halving cycle wave to provide insights into potential price movements and market cycles.
Explore 11,183 indicators. Filter beyond the obvious.
Discover the tools that fit the way you trade.
11,183 tools to explore
A comprehensive Bitcoin trading model that combines power law trend, rainbow chart, and halving cycle wave to provide insights into potential price movements and market cycles.
MVRV Z-Score analyzes Bitcoin's market value and realized value to identify potential market tops and bottoms by measuring valuation extremes.
A risk-adjusted returns indicator for Bitcoin that evaluates asset valuation through a Sharpe Ratio calculation over 180 days, providing color-coded insights into market conditions.
Bitcoin Cycles Indicator tracks market phases by analyzing market cap and transaction volume, revealing potential Bitcoin market valuation stages across different cycle points.
A Sharpe ratio screener that evaluates multiple assets' risk-adjusted returns, categorizing them into valuation zones to help identify investment opportunities.
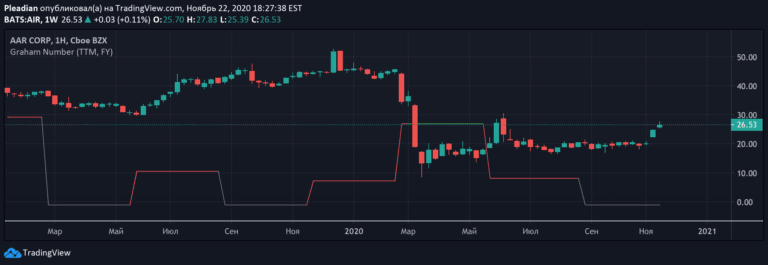
Graham Number is a stock valuation metric that calculates a stock's maximum fair market value by considering earnings per share and book value per share using a specific formula.
The Active Address Sentiment Oscillator (AASO) analyzes Bitcoin's daily active addresses and price returns to provide a macro sentiment indicator for potential market valuation and trend shifts.
MVRV Z-Score helps traders assess cryptocurrency valuation by comparing market capitalization to realized capitalization, providing buy and sell signals based on statistical deviations.
A valuation indicator that calculates fair value levels using moving averages, providing insights into potential overvalued or undervalued market conditions with visual trend projections.
A fair value calculator that estimates a stock's intrinsic worth by analyzing revenue growth, profit margins, and key financial metrics to help investors identify undervalued or overvalued stocks.
The Shiller PE Ratio is a long-term market valuation indicator that measures stock prices relative to inflation-adjusted 10-year average earnings for the S&P 500.
A multi-security valuation index that helps traders identify overvalued and undervalued market conditions by comparing price ratios and calculating dynamic valuation levels across different securities.
Likes, views, and comments are historical TradingView snapshots. They describe attention, not trading performance.