ADX and DI
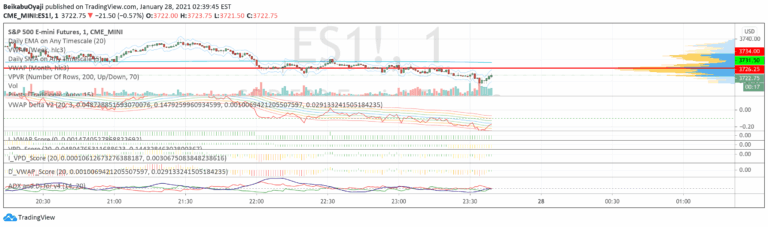
ADX measures trend strength and direction by analyzing price movement. It helps traders identify the presence and power of a trend, indicating whether a market is trending or ranging.
Explore 11,183 indicators. Filter beyond the obvious.
Discover the tools that fit the way you trade.
11,183 tools to explore
ADX measures trend strength and direction by analyzing price movement. It helps traders identify the presence and power of a trend, indicating whether a market is trending or ranging.
A market structure break and order block indicator that identifies trend reversals by analyzing price action breakouts and key candle formations to signal potential trading opportunities.
A custom Tradingview indicator designed to display chart information cleanly while providing a personalized watermark for traders seeking discipline and self-mastery.
A technical analysis indicator using Fibonacci levels and key moving averages to identify market tops, bottoms, and trend directions for precise entry and exit points in trading.
A comprehensive multi-oscillator indicator combining 8 different technical analysis tools into a single, customizable panel for enhanced trading insights and strategy development.
A comprehensive trading chart package featuring multiple integrated indicators designed to provide traders with a multi-dimensional view of market dynamics and potential trend signals.
Advanced moving average system using floating-point mathematics that enables fractional period calculations, creating more responsive and precise trend indicators with dynamic adaptive capabilities.
A trendline trading strategy that uses EMA200, triangle patterns, and resistance/support lines to identify potential entry and exit points in market trends.
Polyphase MACD provides a continuous, smooth estimate of higher timeframe momentum by using phase-shifted calculations and advanced filtering techniques.
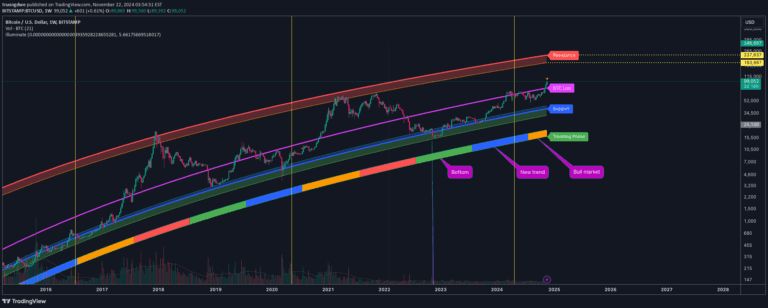
A Bitcoin price prediction script using logarithmic regression that analyzes historical trends, halvings, and potential price ranges to provide strategic insights into long-term Bitcoin market movements.
An advanced Ultimate Oscillator indicator using user-defined types in Pine Script. It features dynamic color plotting and multi-timeframe support for analyzing price momentum.
A multi-timeframe indicator that visualizes price ranges across two different time periods using color-coded boxes for trend analysis and support/resistance identification.
Likes, views, and comments are historical TradingView snapshots. They describe attention, not trading performance.