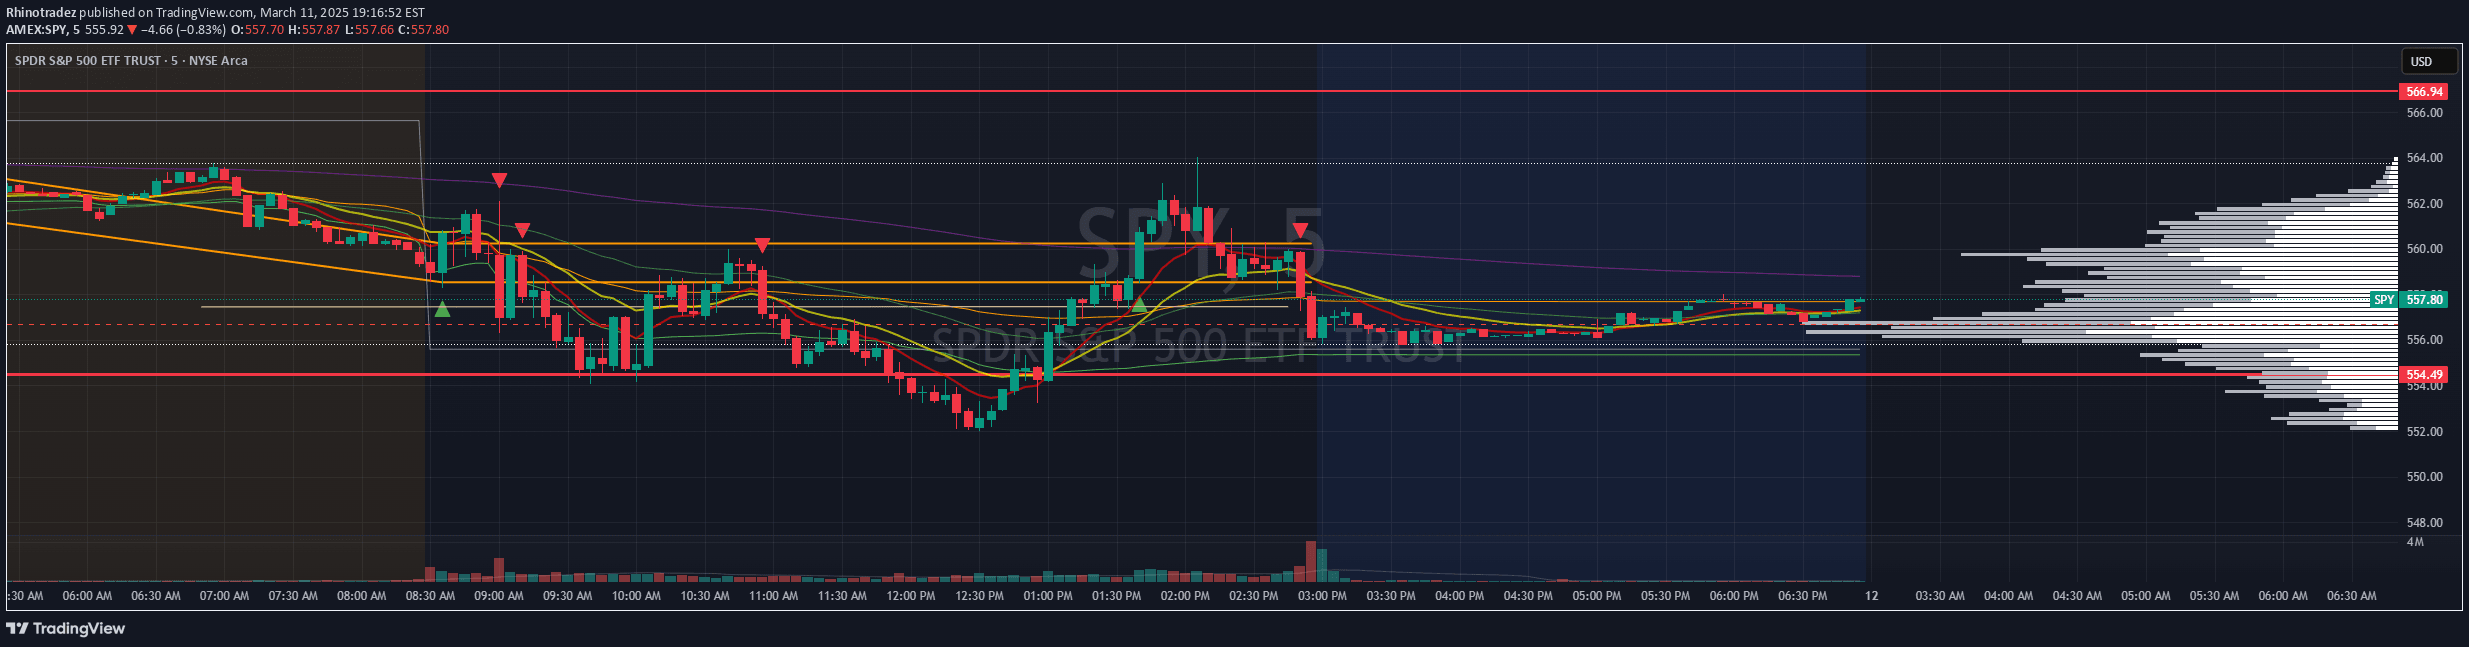
Highest-Lowest Trend
A trend indicator that tracks price movement by analyzing highest and lowest values within a specified period, helping traders identify potential trend changes and market direction.
Explore 11,183 indicators. Filter beyond the obvious.
Discover the tools that fit the way you trade.
11,183 tools to explore
A trend indicator that tracks price movement by analyzing highest and lowest values within a specified period, helping traders identify potential trend changes and market direction.
Tether Ratio Channel tracks the relationship between Bitcoin market cap and stablecoin market cap, generating precise trading signals by analyzing the ratio's movement within a normalized channel.
An options-based indicator that displays implied price ranges, providing context about potential market movements by analyzing options pricing and calculating expected range of price action.
A MACD-based indicator that provides early warning signals for potential price reversals by analyzing the histogram difference between MACD and its signal line.
An advanced trading signal that identifies market reversals by detecting price action that breaks typical expectations through downside and upside reversal patterns.
A Point and Figure vertical price target script that calculates potential price targets based on chart movements, allowing traders to hover over columns and view upside and downside targets.
Level Presets (BLP) is a tool for setting performance targets by defining upward and downward price levels relative to the current asset price.
A trading tool that allows setting key support/resistance levels and detecting price breaks, with customizable alerts and visual tracking of market movements.
15-Minute Opening Range Breakout (ORB) strategy tracks the first 15 minutes of market trading. Identifies potential breakout opportunities by marking high and low price levels for traders.
The Retail Pain Index is a behavioral volatility tool that measures market stress by tracking how far price moves from the average entry zone, revealing potential trading opportunities.
A technical tool that visualizes potential reward and risk levels by analyzing price action, moving averages, and volatility to help traders make informed trading decisions.
An indicator measuring a symbol's current price relative to its all-time high, providing insights into potential future gains and market performance.
Likes, views, and comments are historical TradingView snapshots. They describe attention, not trading performance.