
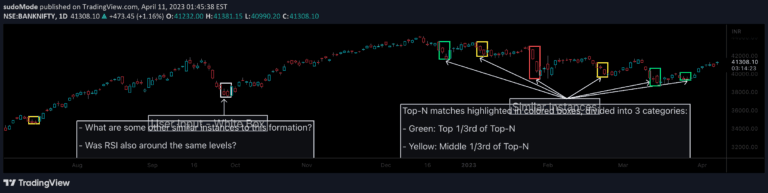
Sniffer
A pattern recognition tool that analyzes price chart similarities by computing vector-based similarities across multiple candle dimensions, highlighting potential matching historical patterns.
Explore 11,183 indicators. Filter beyond the obvious.
Discover the tools that fit the way you trade.
11,183 tools to explore
A pattern recognition tool that analyzes price chart similarities by computing vector-based similarities across multiple candle dimensions, highlighting potential matching historical patterns.
A sophisticated Pine Script indicator that renders 3D objects on trading charts, providing unique visualization of market trends through advanced geometric rendering techniques.
A multi-vector moving average indicator that calculates five different moving averages to assess trend alignment and momentum by comparing Hull Moving Averages with an origin ALMA moving average.
Lyapunov Market Instability uses chaos theory to analyze market dynamics, revealing whether markets are trending or ranging by measuring trajectory divergence and regime changes.
An experimental probability indicator that predicts potential price movements by classifying returns into five categories based on historical price and technical indicator data.
A comprehensive trading indicator suite analyzing institutional levels, EMAs, and volume candles to help traders identify high-probability trade setups across multiple market conditions.
Similarity measures are statistical methods that quantify the distance and relationship between different data sets, comparing vectors, strings, and probability distributions across various dimensions.
Likes, views, and comments are historical TradingView snapshots. They describe attention, not trading performance.