YOUR INDICATOR RESEARCH STARTS HERE

Find the right indicator.
Understand what it does.

Explore 11,183 indicators. Filter beyond the obvious.
Discover the tools that fit the way you trade.

THE INDICATOR LIBRARY

Results for “wt”

11,183 tools to explore

92 indicators matching your filters
Save search
LevelsSignal

Quarterly Earnings

by finallynitin

A TradingView script that displays quarterly earnings per share and sales data with year-on-year percentage changes, offering customizable visualization of financial performance metrics.

Main price chart · unverifiedSwing Trading
Explore
3.7Klikes44.7Kviews66comments
Save
MomentumTrend

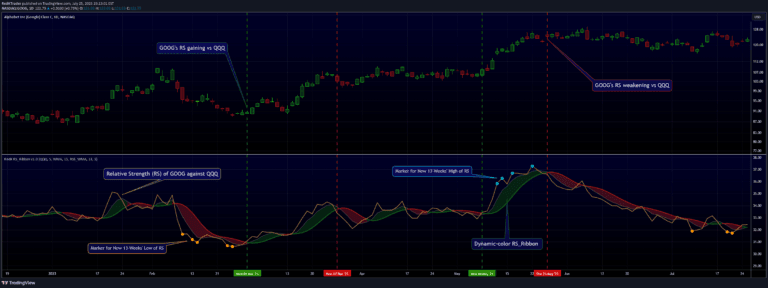
RS Rating

by Fred6724

The RS Rating evaluates a stock's price performance relative to the market over 52 weeks, helping traders identify stocks that are outperforming and potentially poised for further gains.

Separate pane · unverifiedDay Trading · Swing Trading
Explore
3.4Klikes45.4Kviews223comments
Save
MomentumOrder FlowSignal

Standardized Orderflow [AlgoAlpha]

by AlgoAlpha

A comprehensive order flow indicator that analyzes market sentiment through volume analysis, tracking order flow velocity and providing customizable display modes for traders.

Separate pane · unverifiedScalping · Day Trading
Explore
1.9Klikes47Kviews12comments
Save
TrendMomentumEditor’s pick

Financial Growth

by morzor61

A financial analysis tool that compares quarterly, annual, and TTM performance metrics, providing comprehensive insights into company growth through various financial indicators and visualization options.

Separate pane · unverifiedSwing Trading
Explore
1.3Klikes35.5Kviews63comments
Save
TrendVolatilityEditor’s pick

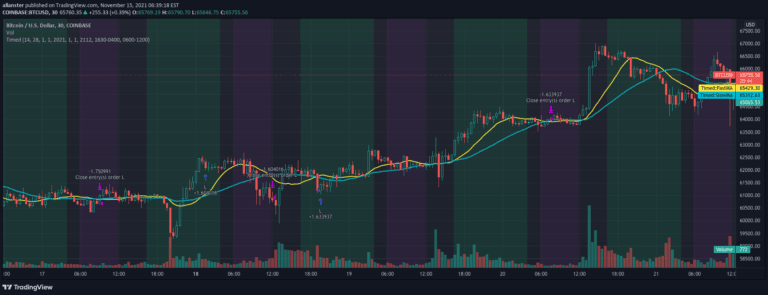
How To Set Backtest Time Ranges

by allanster

A script demonstrating time range backtesting techniques for trading strategies, enabling precise testing of entry and exit points within specific date ranges.

Main price chart · unverifiedDay Trading · Swing Trading
Explore
1.2Klikes38.4Kviews40comments
Save
SignalVolume

OrderFlow Absorption Indicator

by nico-von

An indicator that identifies price absorption points by tracking volume accumulation at specific levels, revealing potential market sentiment shifts and liquidity zones.

Main price chart · unverifiedScalping · Day Trading
Explore
1.1Klikes30.6Kviews9comments
Save
TrendMomentumEditor’s pick

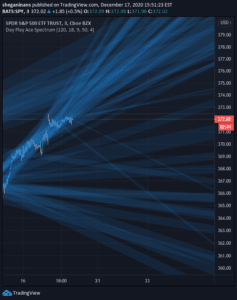
Daily Play Ace Spectrum

by sheganinans

Daily Play Ace Spectrum is an advanced, configurable trading indicator extending the original Ace Spectrum with more parameters for enhanced sensitivity and adaptability across shorter timeframes.

Separate pane · unverifiedScalping · Day Trading
Explore
860likes23.8Kviews10comments
Save
TrendSignal

Bitcoin Limited Growth Model

by EliCobra

An advanced Bitcoin price prediction model using Stock-to-Flow ratio with nonlinear analysis, offering refined insights into cryptocurrency market dynamics and potential price movements.

Separate pane · unverifiedSwing Trading
Explore
737likes8.8Kviews2comments
Save

Likes, views, and comments are historical TradingView snapshots. They describe attention, not trading performance.

START WITH A QUESTION

A little less searching.
A lot more understanding.

Tell DeepAlpha what you need. Get an explanation, a shortlist,
and a direct path to the indicators behind it.

Ask DeepAlpha