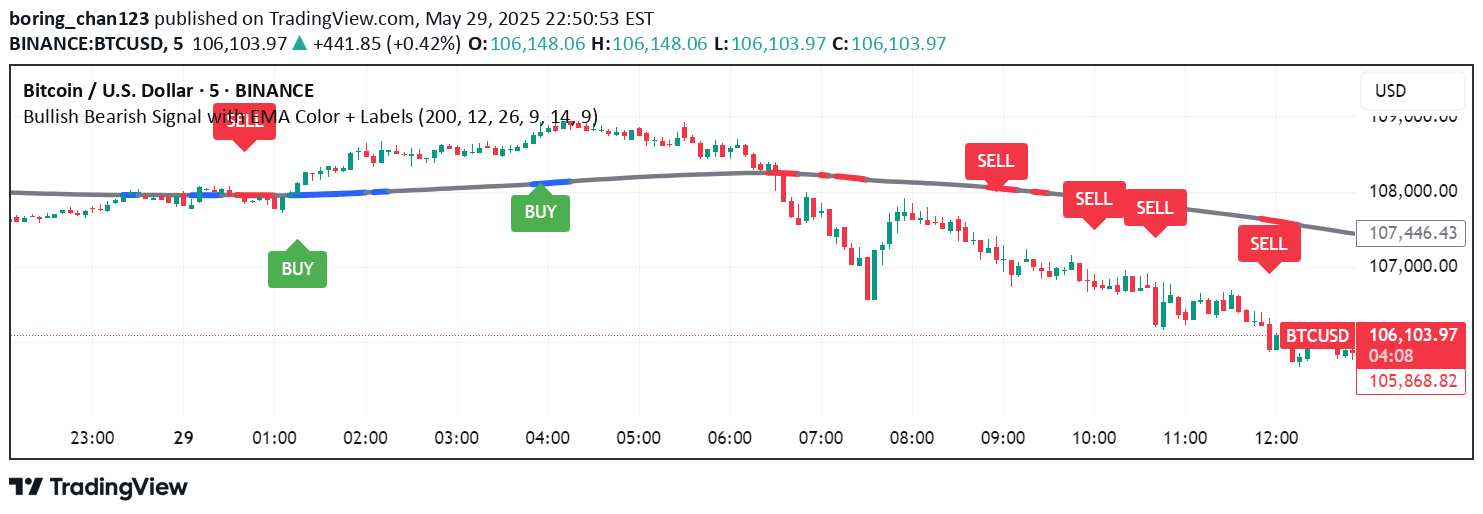
A market bias indicator using Heikin Ashi candles and oscillators to identify trend strength and potential reversals across different timeframes with customizable settings.
Explore complementary indicator rolesHow it works
The Bias Finder indicator operates by transforming traditional price candles into Heikin Ashi candles, which smooth price action and help visualize trend direction. It calculates an oscillator based on the difference between smoothed opening and closing prices from a selected higher timeframe, creating a dynamic representation of market momentum.
The indicator uses color-coded signals to represent trend strength: light teal indicates a strong bullish trend, dark teal shows a weakening bullish trend, light red signifies a strong bearish trend, and dark red represents a weakening bearish trend. Optional standard deviation bands can be displayed to help identify potential breakout areas, providing traders with multiple layers of trend analysis.
Why it may be useful
The Bias Finder indicator helps traders cut through market noise by providing a more refined view of trend dynamics and potential reversals. By leveraging Heikin Ashi candles and a custom oscillator, it offers a more nuanced perspective on market movement that goes beyond traditional price charts, allowing traders to make more informed decisions.
Its adaptability through customizable settings like oscillator period and timeframe selection makes it a versatile tool for traders across different market conditions and trading styles. The visual color-coding and optional standard deviation bands provide quick, intuitive insights into market trends, helping traders quickly assess potential trading opportunities.
When to explore it
The Bias Finder indicator is most effective in markets with clear trending characteristics, such as forex, stocks, and cryptocurrencies during periods of sustained directional movement. Traders can optimize its use by selecting appropriate higher timeframes that align with their trading strategy, whether focusing on short-term scalping or longer-term swing trading.
The indicator works best when combined with other technical analysis tools and risk management strategies. Traders should use it as part of a comprehensive trading approach, paying attention to the color-coded bias signals, oscillator strength, and standard deviation bands to confirm potential entry and exit points.
Keep exploring
What we’ve verified
Access, alerts and repainting behaviour have not been independently verified for this indicator. Check the creator’s current publication and settings.
General descriptions and classifications are recovered research. Verified details above identify the specific checks we have completed. Check the creator’s current publication for later changes.