Volume Profile Auto [line]
A volume profile indicator that visualizes trading volume across different time frames using lines and boxes, providing unique insights into volume distribution and market activity.
Explore 11,183 indicators. Filter beyond the obvious.
Discover the tools that fit the way you trade.
11,183 tools to explore
A volume profile indicator that visualizes trading volume across different time frames using lines and boxes, providing unique insights into volume distribution and market activity.
A Market Profile indicator that visualizes price and volume distribution, highlighting key trading levels and providing insights into market structure through time-price opportunity (TPO) analysis.
A sophisticated trading indicator combining polynomial regression with dynamic Keltner Channels to analyze market trends, volatility, and potential trading opportunities across multiple timeframes.
A volume profile indicator that creates an angled linear regression channel to analyze trading activity and volume distribution across price ranges during a specific time interval.
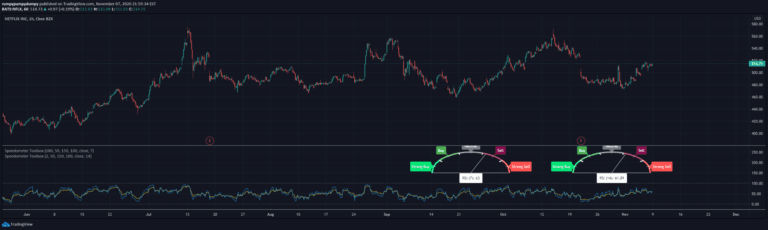
Custom metric speedometers provide specialized visualization techniques for tracking and representing performance indicators through graphical gauge-like representations.
An advanced volume profile indicator that separates buying and selling volume across up to 10 custom trading ranges, providing detailed insights into market sentiment and trading dynamics.
A comprehensive trend and strength indicator that uses moving averages and standard deviation to identify market trends, providing color-coded signals and a dynamic strength gauge for traders.
A multi-level trend classification tool that detects market momentum using adaptive smoothing, color-coded candles, and dynamic trend bands to help traders identify trend strength and potential reversals.
Open Interest Chart visualizes futures market activity using a circular plot that tracks percentage changes in open interest, indicating money flow and market liquidity.
A sophisticated price trend indicator using LOWESS smoothing algorithm that filters price noise, reveals market trends, and integrates RSI momentum analysis for comprehensive market insights.
An indicator that automatically marks prior day and pre-market high and low levels across the entire trading session, helping traders identify key price reference points.
RSI Past is a custom trading signal that tracks the directional momentum of a stock by comparing the number of bars since recent overbought and oversold RSI conditions.
Likes, views, and comments are historical TradingView snapshots. They describe attention, not trading performance.