
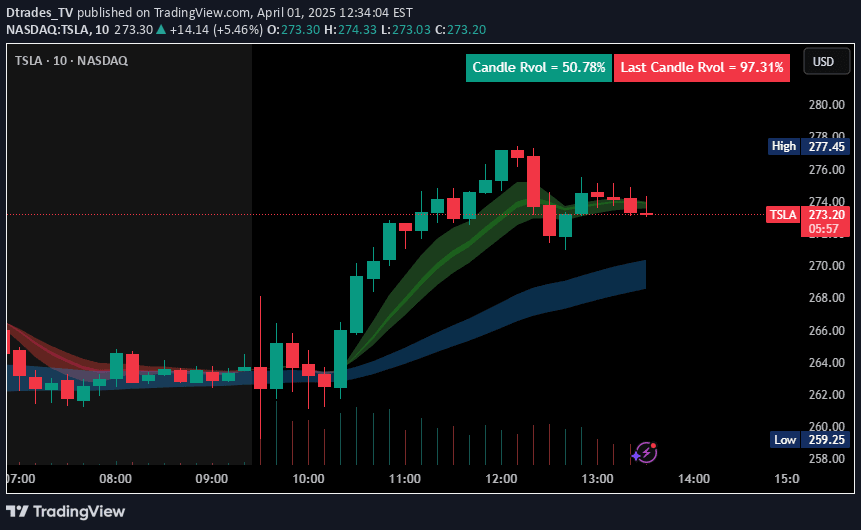
Candle Rvol is a dynamic volume indicator that compares current 10-minute candle volume against historical 14-day volumes, providing real-time relative volume percentage and visual volume tracking.
Explore complementary indicator rolesHow it works
The Candle Rvol indicator operates by creating an array of volume data for every 10-minute candle over the past 14 trading days. It dynamically compares the current candle's volume against the average volume of corresponding historical candles, calculating a percentage-based relative volume metric.
The indicator checks volume progression every minute during the current 10-minute candle. If the volume is projected to exceed 100% of the historical average, the background color changes to green, providing a visual volume momentum signal
Why it may be useful
Candle Rvol provides traders with a sophisticated volume analysis tool that eliminates potential volume skewing near market open and close. By offering a dynamic, percentage-based volume comparison, traders can quickly identify unusual trading activity and potential momentum shifts.
The real-time background color change offers an intuitive visual cue about volume intensity, helping traders make more informed decisions about market participation and potential trend strength
When to explore it
Candle Rvol is most effective for day traders operating on 10-minute charts who want to monitor volume dynamics in real-time. It works best in liquid markets with consistent trading activity, such as major stock indices, forex pairs, and high-volume stocks.
Traders should use this indicator during active trading hours when volume patterns are most representative. It is particularly useful for identifying potential breakouts, confirming trend strength, and detecting early momentum shifts
Keep exploring
What we’ve verified
Access, alerts and repainting behaviour have not been independently verified for this indicator. Check the creator’s current publication and settings.
General descriptions and classifications are recovered research. Verified details above identify the specific checks we have completed. Check the creator’s current publication for later changes.


