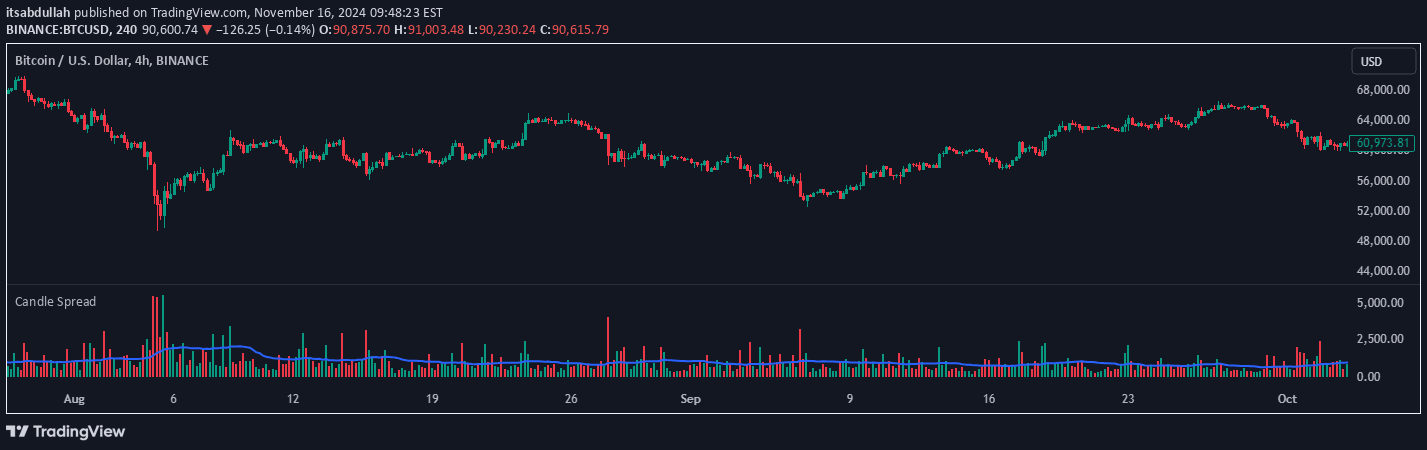
Candle Spread is a volatility indicator that measures price range within candles, displaying the difference between high and low prices in a separate panel.
Explore complementary indicator rolesHow it works
The Candle Spread indicator calculates the price range of each candle by subtracting the low price from the high price. This creates a visual representation of price movement volatility in a separate panel below the main chart. Each bar represents the absolute price range for a specific trading period, with the length of the bar directly corresponding to the magnitude of price movement.
The indicator uses color coding to distinguish between bullish and bearish candles, with green bars representing bullish candles and red bars representing bearish candles. Additionally, a 30-period Simple Moving Average (SMA) is overlaid on the candle spread bars to provide a smoother, averaged view of the overall market volatility.
Why it may be useful
The Candle Spread indicator is crucial for traders because it provides a clear visual representation of market volatility and price movement dynamics. By displaying the range of each candle, traders can quickly identify periods of high and low volatility, which can signal potential trading opportunities or market shifts. The color-coded bars make it easy to distinguish between bullish and bearish price action at a glance.
The included 30-period SMA helps traders understand the overall trend of market volatility, smoothing out short-term fluctuations and providing a more comprehensive view of price movement. This can be particularly useful for making informed trading decisions, managing risk, and identifying potential trend reversals or momentum changes.
When to explore it
The Candle Spread indicator is most effective during periods of significant market movement, such as during major economic announcements, earnings reports, or other events that can cause substantial price fluctuations. Traders can use this indicator to identify potential entry and exit points by observing sudden changes in candle range or sustained volatility patterns. It is particularly useful in markets with high liquidity and active trading.
Traders should pay special attention to instances where the candle spread bars show unusually large ranges, as these can indicate potential trend reversals or significant market momentum shifts. The indicator is versatile and can be applied across various financial markets, including stocks, forex, cryptocurrencies, and commodities, making it a valuable tool for traders across different asset classes.
Keep exploring
What we’ve verified
Access, alerts and repainting behaviour have not been independently verified for this indicator. Check the creator’s current publication and settings.
General descriptions and classifications are recovered research. Verified details above identify the specific checks we have completed. Check the creator’s current publication for later changes.