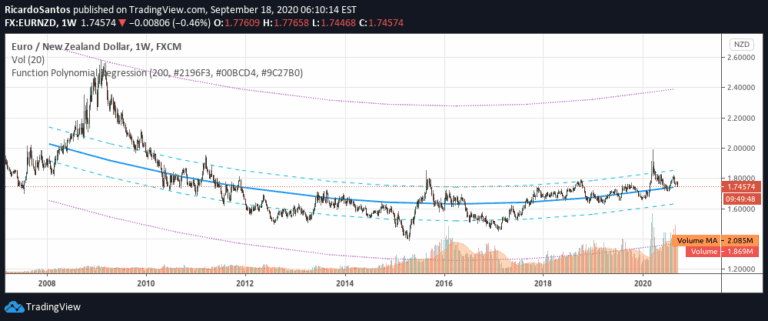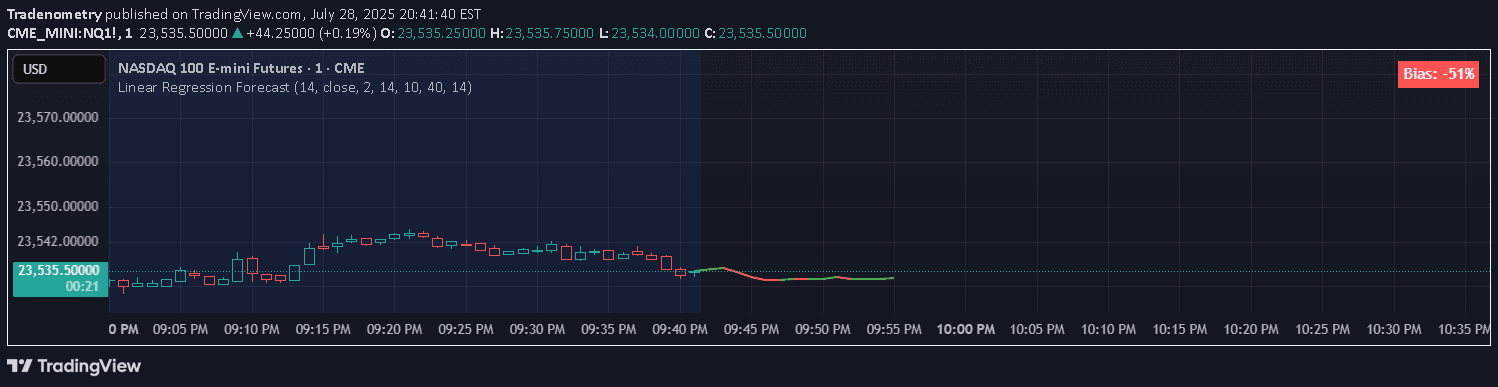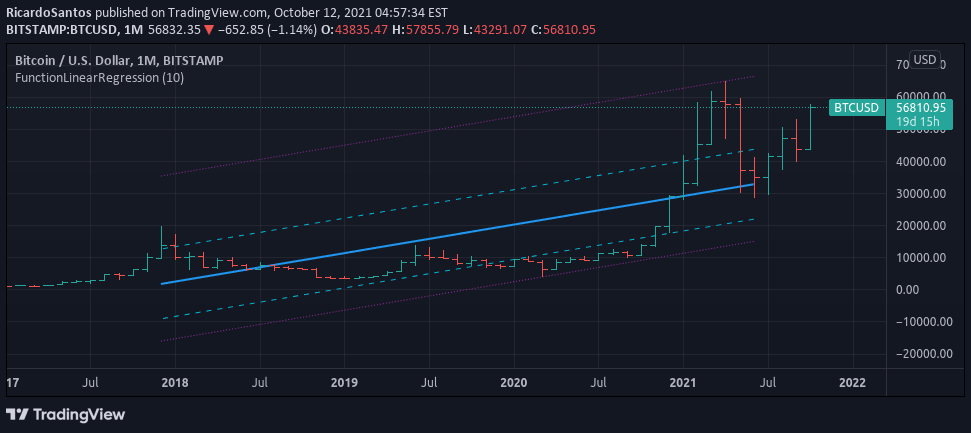
Linear Regression is a statistical method for analyzing linear relationships between sample points, providing predictions and measuring deviation in financial data analysis.
Explore complementary indicator rolesHow it works
Linear Regression works by fitting a straight line through a set of data points to minimize the overall distance between the line and the points. The method calculates the best-fitting line by using the least squares approach, which reduces the sum of squared vertical distances from the data points.
It generates predictions by extrapolating the trend line and provides statistical measurements like maximum and minimum deviations. The technique helps traders understand the underlying trend direction and potential future price movements by mathematically modeling the relationship between variables
Why it may be useful
Linear Regression is crucial for traders because it offers a systematic approach to understanding market trends and potential price movements. By providing a mathematical model of price relationships, it helps traders make more informed decisions based on statistical analysis.
The method can reveal underlying trends that might not be immediately visible through visual inspection alone. It also provides valuable insights into market dynamics by measuring deviation and predicting potential future price points. Traders can use these insights to develop more robust trading strategies and improve their risk management approaches
When to explore it
Linear Regression is most effective when analyzing markets with relatively consistent trends and clear directional movements. It works best in markets with moderate volatility where linear relationships between variables are more pronounced.
Traders should use this method when seeking to understand long-term price trends, identify potential support and resistance levels, and develop predictive models. It is particularly useful in swing trading and longer-term investment strategies. The technique is most reliable when applied to financial instruments with smoother, less erratic price movements
Keep exploring
What we’ve verified
Access, alerts and repainting behaviour have not been independently verified for this indicator. Check the creator’s current publication and settings.
General descriptions and classifications are recovered research. Verified details above identify the specific checks we have completed. Check the creator’s current publication for later changes.