YOUR INDICATOR RESEARCH STARTS HERE

Find the right indicator.
Understand what it does.

Explore 11,183 indicators. Filter beyond the obvious.
Discover the tools that fit the way you trade.

THE INDICATOR LIBRARY

Results for “MATH”

11,183 tools to explore

40 indicators matching your filters
Save search
TrendMomentumEditor’s pick

[JRL] MM Fibonacci

by JRL_6

A unique trading indicator combining Murrey Math formulas with Fibonacci retracement levels to identify potential market tops, bottoms, and long-term trend dynamics with enhanced precision.

Main price chart · unverifiedSwing Trading
Explore
4.4Klikes80.6Kviews60comments
Save
TrendMomentumEditor’s pick

Rolling largest Impulse Murreys Lines

by RicardoSantos

A trading signal using Kadane's algorithm to identify the largest market impulse within a window, then applying Murrey's math lines to map potential price movements and trading opportunities.

Main price chart · unverifiedDay Trading · Swing Trading
Explore
3.6Klikes84.5Kviews64comments
Save
TrendSignal

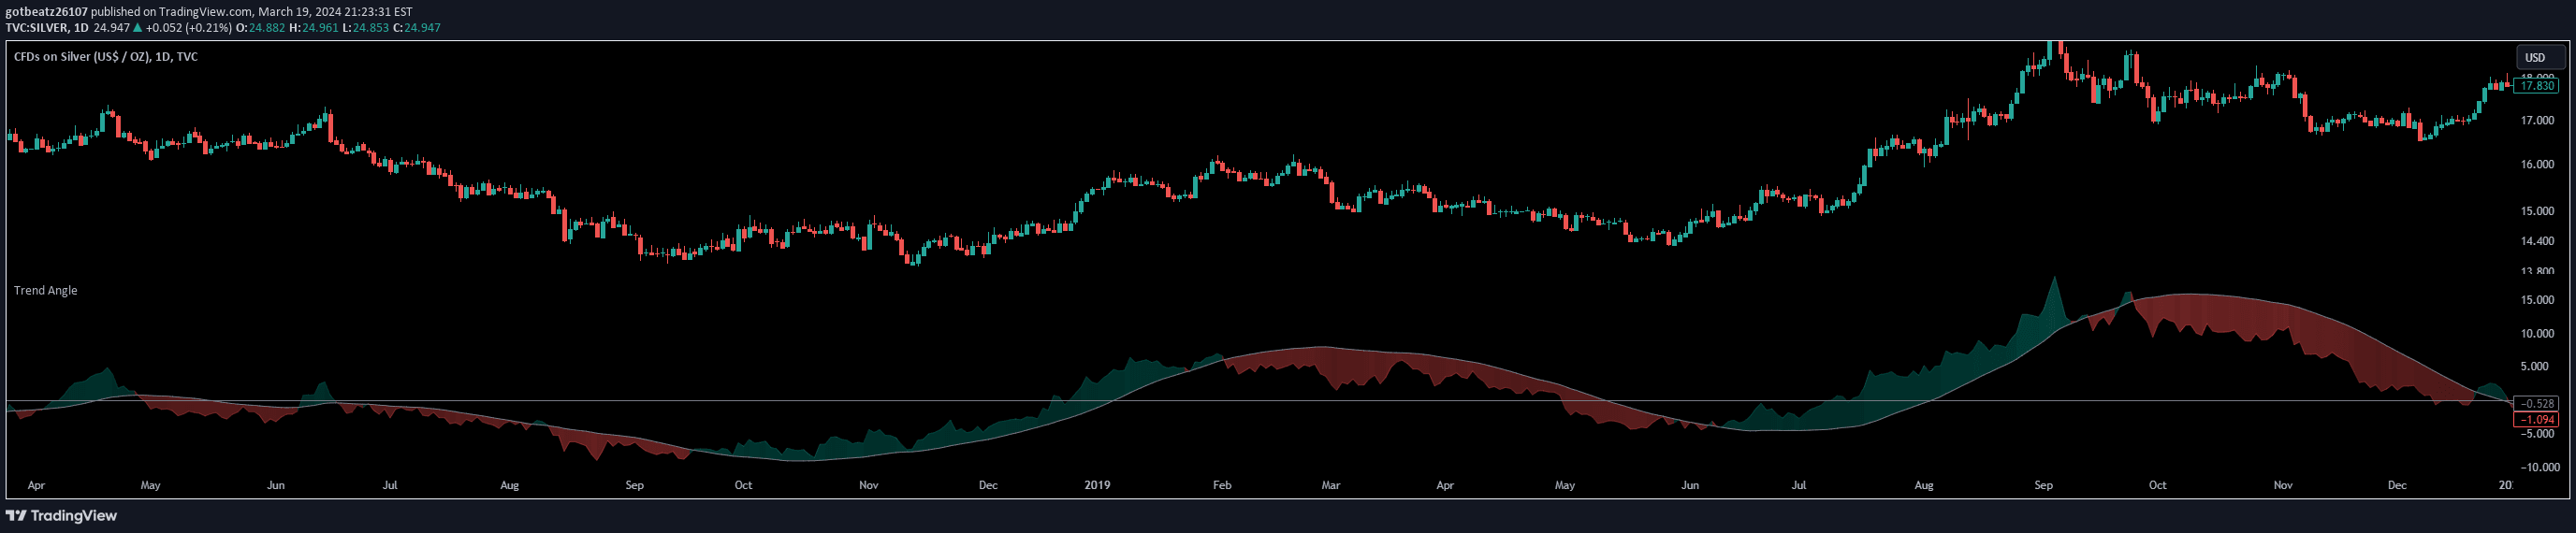
Trend Angle

by mezor13

Trend Angle calculates the inclination of price movements over a specified timeframe, providing traders with a quantitative method to assess market directionality and momentum.

Separate pane · unverifiedScalping · Day Trading
Explore
811likes17.2Kviews12comments
Save
LevelsSignal

Math by Thomas Liquidity Pool

by MathThomas

A TradingView indicator that identifies potential liquidity pools by detecting areas with clustered equal highs or lows, helping traders anticipate price reactions and stop loss zones.

Main price chart · unverifiedScalping · Day Trading
Explore
586likes9.8Kviews1comments
Save
SignalTrend

MATHR3E RAMP-MA

by MATHR3E

MATHR3E RAMP-MA is a trend-following indicator that helps traders identify market direction and potential entry points using moving average crossovers and rate of change analysis.

Main price chart · unverifiedDay Trading · Swing Trading
Explore
544likes11.3Kviews0comments
Save
SignalLevels

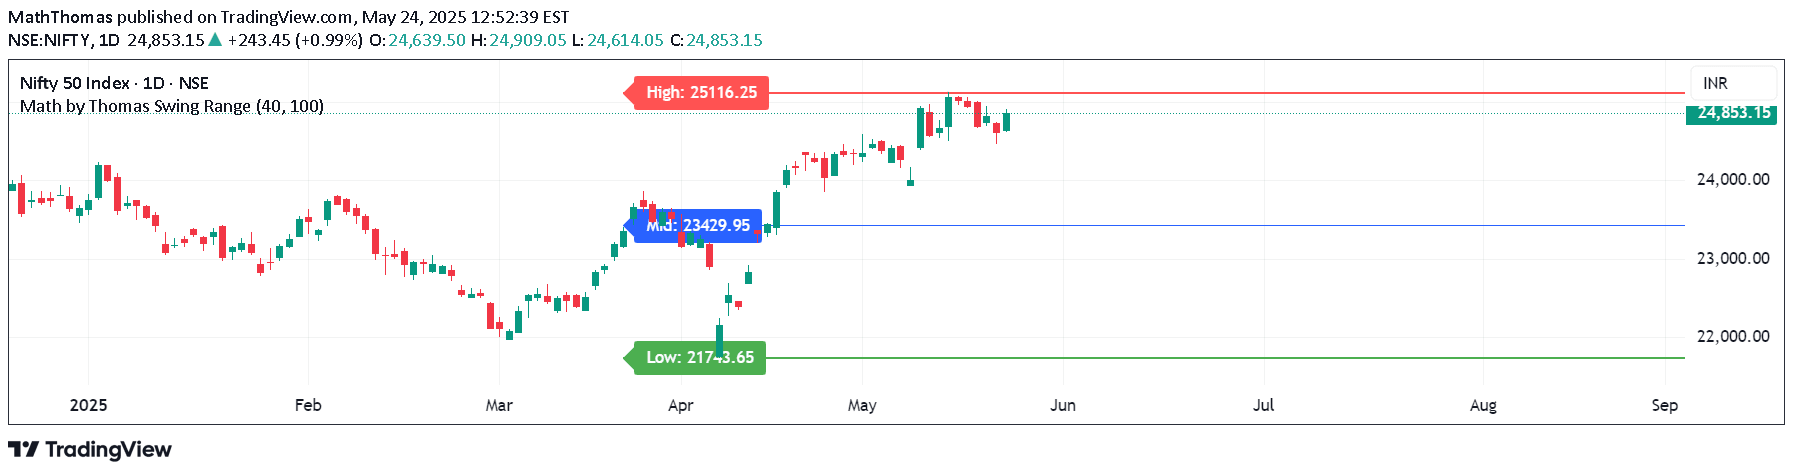
Math by Thomas Swing Range

by MathThomas

A swing range indicator that identifies key market levels by calculating the highest high, lowest low, and midpoint over a specified lookback period to help traders analyze potential support and resistance zones.

Main price chart · unverifiedDay Trading · Swing Trading
Explore
519likes9.7Kviews5comments
Save
SignalTrendVolume

Math Trading Concepts [SS]

by Steversteves

A comprehensive trading indicator combining volume analysis, Z-Score bands, autoregressive forecasting, and ANOVA variance analysis to identify potential market trends and trading opportunities.

Main price chart · unverifiedScalping · Day Trading
Explore
433likes10.5Kviews18comments
Save
SignalTrend

Rainbow Drift Beta

by math_rave

Rainbow Drift Beta is an EMA-based indicator that detects trend direction and potential entry points by analyzing multiple exponential moving averages across different timeframes.

Main price chart · unverifiedScalping · Day Trading
Explore
405likes7.4Kviews8comments
Save
ChannelsSignalTrend

Bitcoin wave model

by leoum

Bitcoin wave model uses logarithmic regression and sinusoidal waves to predict price movements based on halving events, creating a predictive channel for cryptocurrency price forecasting.

Main price chart · unverifiedSwing Trading
Explore
280likes5.3Kviews9comments
Save

Likes, views, and comments are historical TradingView snapshots. They describe attention, not trading performance.

START WITH A QUESTION

A little less searching.
A lot more understanding.

Tell DeepAlpha what you need. Get an explanation, a shortlist,
and a direct path to the indicators behind it.

Ask DeepAlpha