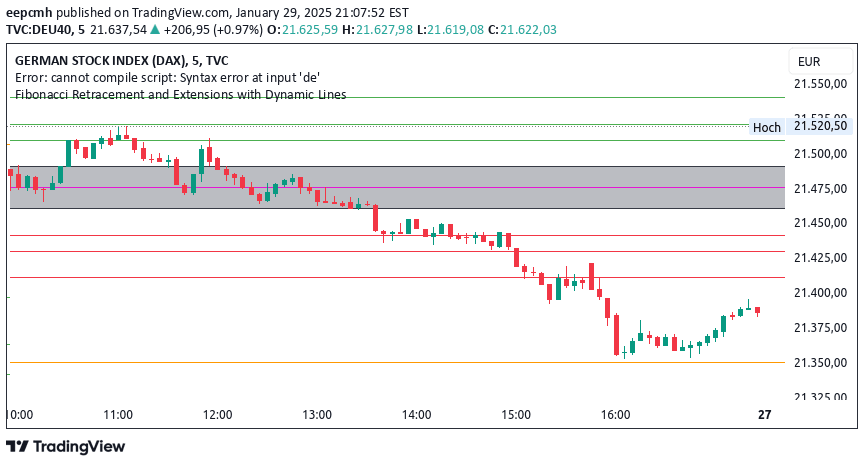
A trading strategy using the first trading hour's range to generate Fibonacci levels for identifying potential support and resistance zones in the DE40 market.
Explore complementary indicator rolesHow it works
The strategy begins by identifying and recording the high and low price points during the first trading hour (9-10 am) for the DE40 index. Once these points are established, a gray box is drawn to visually represent the initial trading range. The system then calculates precise Fibonacci levels both above and below this range, using key retracement levels including 1.61, 2, 2.61, and 4.61.
These Fibonacci levels serve as potential support and resistance zones, providing traders with strategic entry and exit points. By anchoring the calculations to the first hour's price movement, the indicator offers a dynamic and adaptable approach to market analysis that can help traders identify potential price reversals and trend continuation patterns.
Why it may be useful
Fibonacci levels are powerful tools for understanding potential market movements by highlighting key psychological price levels where traders might expect price action to pause or reverse. By focusing on the first trading hour's range, this strategy captures the initial market sentiment and provides a structured framework for making trading decisions.
The method offers traders a systematic approach to identifying potential trading opportunities, reducing emotional decision-making and providing a more objective analysis of market dynamics. By using mathematically derived levels, traders can develop more disciplined entry and exit strategies based on statistical price behavior.
When to explore it
This strategy is most effective during active trading hours, particularly for short-term trading styles like scalping and day trading. It works best in markets with consistent liquidity and clear opening hour patterns, such as the DE40 index, where the first hour's trading range can be representative of broader market sentiment.
Traders should be most attentive to this signal during periods of high market volatility or when significant economic news might impact market movements. It is particularly useful for traders who prefer a structured, rule-based approach to identifying potential trade setups and managing risk.
Keep exploring
What we’ve verified
Access, alerts and repainting behaviour have not been independently verified for this indicator. Check the creator’s current publication and settings.
General descriptions and classifications are recovered research. Verified details above identify the specific checks we have completed. Check the creator’s current publication for later changes.