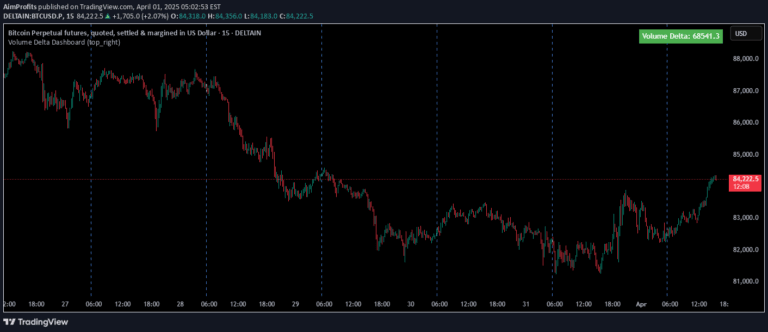
A multi-dimensional trading indicator combining Fractal ROC, ATR Break, and Order Blocks to identify market momentum shifts, significant price movements, and potential trade opportunities.
Explore complementary indicator rolesHow it works
The indicator calculates momentum through Fractal ROC by measuring price changes between fractal turning points, determining potential market momentum shifts. It compares closing prices with previous period lows and calculates a rate of change that signals potential trend reversals when exceeding a specified break level.
Simultaneously, ATR Break assesses market volatility by measuring price movements relative to the Average True Range. When price movements exceed a predefined ATR break level, the indicator identifies significant market movements. Order Blocks are then created by drawing boxes representing price levels with notable trading activity, helping traders visualize critical support and resistance zones.
Why it may be useful
By integrating multiple analytical concepts, this indicator provides traders with a comprehensive view of market dynamics, enabling more informed trading decisions. It combines momentum analysis, volatility assessment, and price structure recognition to help traders identify potential entry and exit points with greater precision.
The multi-dimensional approach allows traders to understand not just price movement, but the underlying market structure and momentum. This holistic perspective can help reduce trading risk by providing multiple confirmation signals and offering insights into potential market behavior beyond traditional single-indicator analysis.
When to explore it
This indicator works best in markets with clear trending characteristics and moderate to high volatility, where price movements can be more predictably analyzed. It is particularly effective in identifying potential trend reversals, breakouts, and significant price level interactions across various financial instruments and timeframes.
Traders should apply this indicator in conjunction with other technical analysis tools and fundamental research to validate signals. It is most reliable when used in markets with sufficient liquidity and during periods of consistent trading volume, such as major market sessions for forex, stocks, and cryptocurrency trading.
Keep exploring
What we’ve verified
Access, alerts and repainting behaviour have not been independently verified for this indicator. Check the creator’s current publication and settings.
General descriptions and classifications are recovered research. Verified details above identify the specific checks we have completed. Check the creator’s current publication for later changes.