A trading strategy using 200-period moving average and its multipliers to identify long-term trend direction and potential support/resistance zones across different market conditions.
Explore complementary indicator rolesHow it works
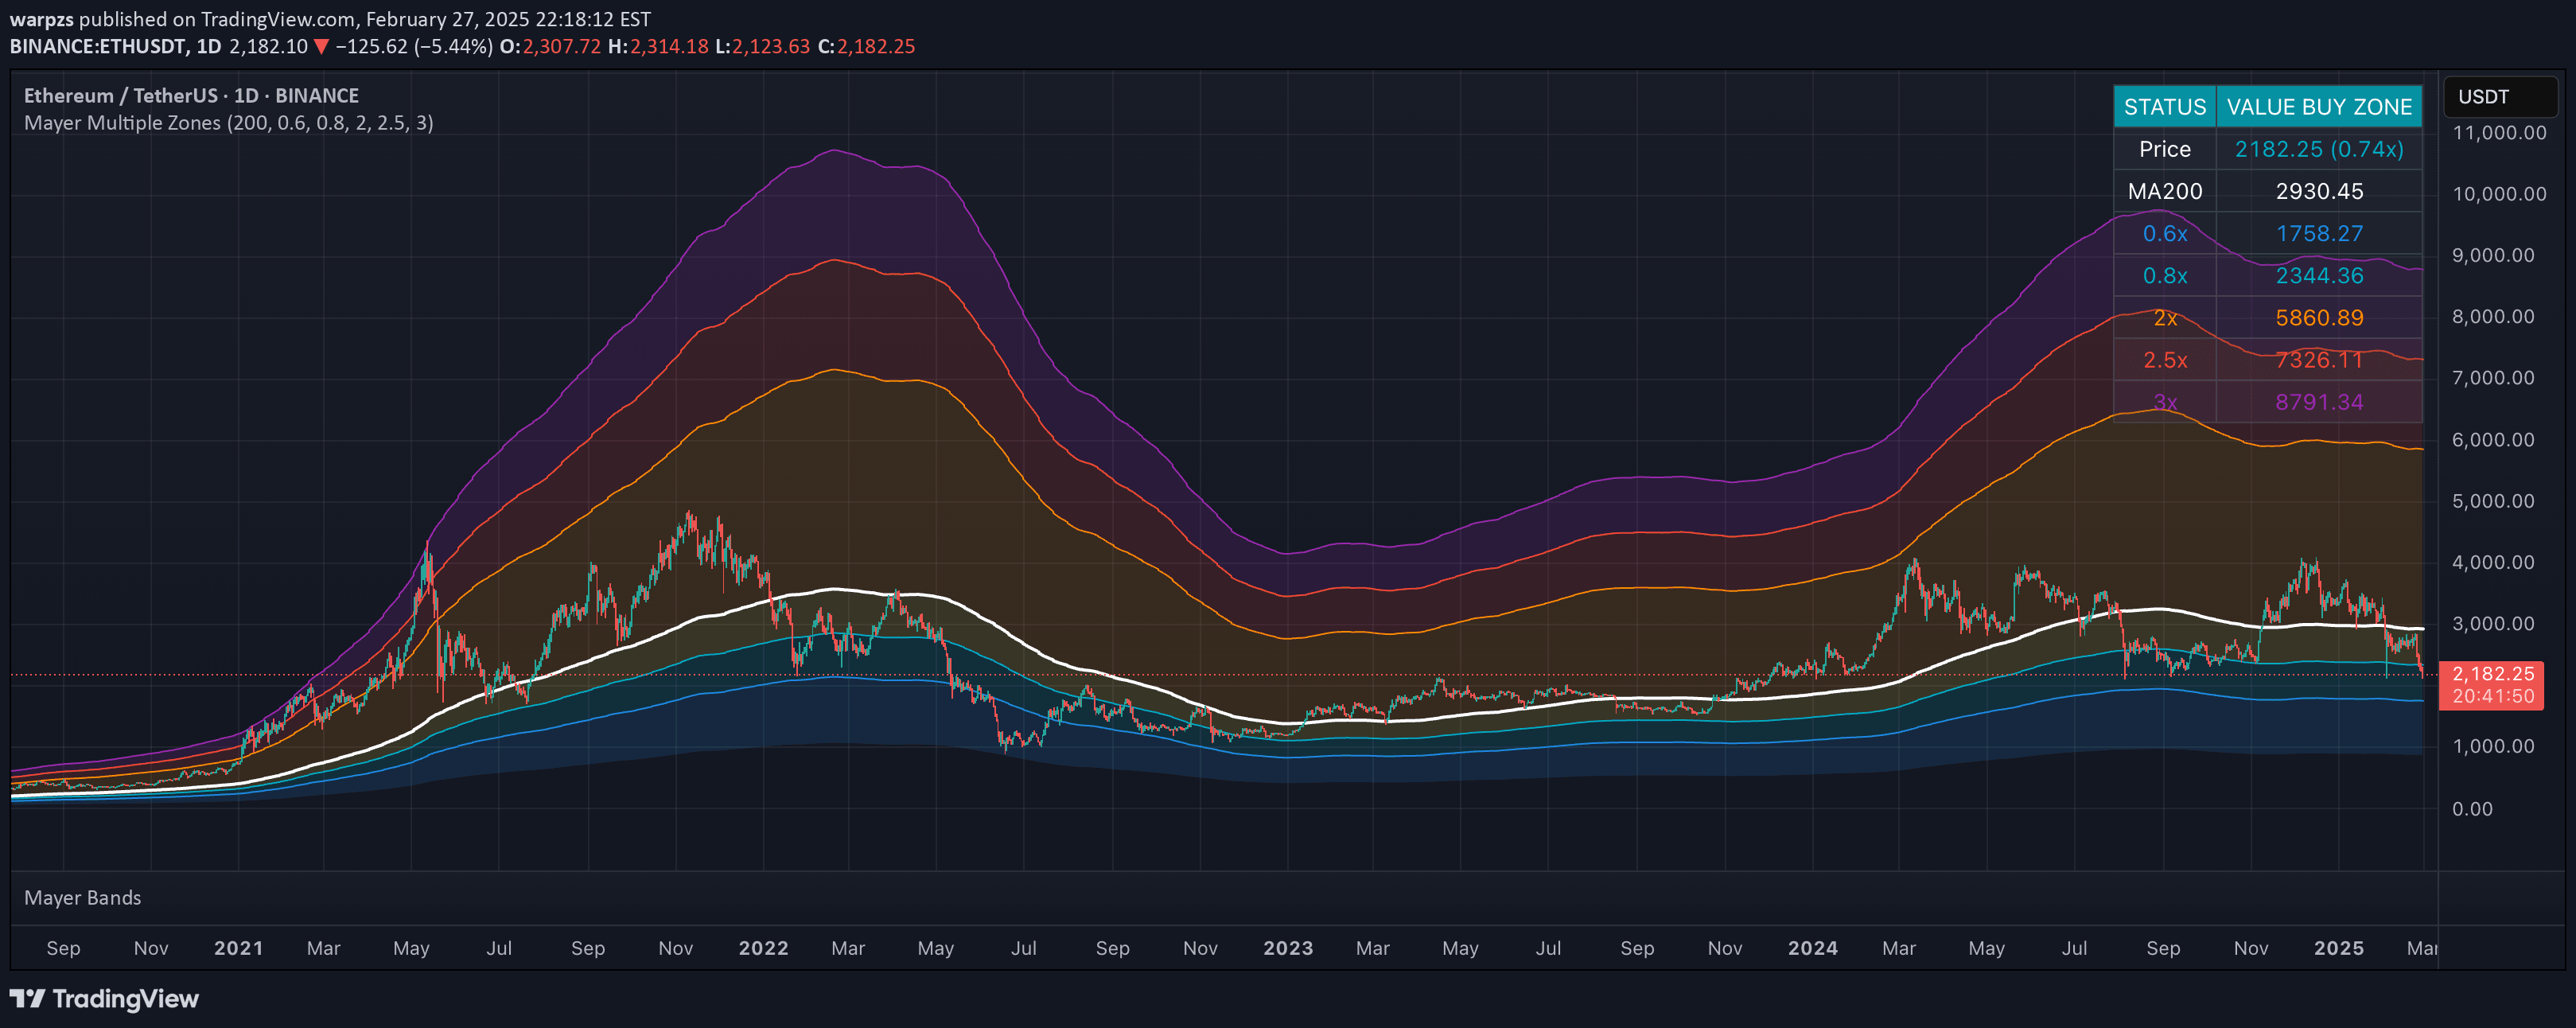
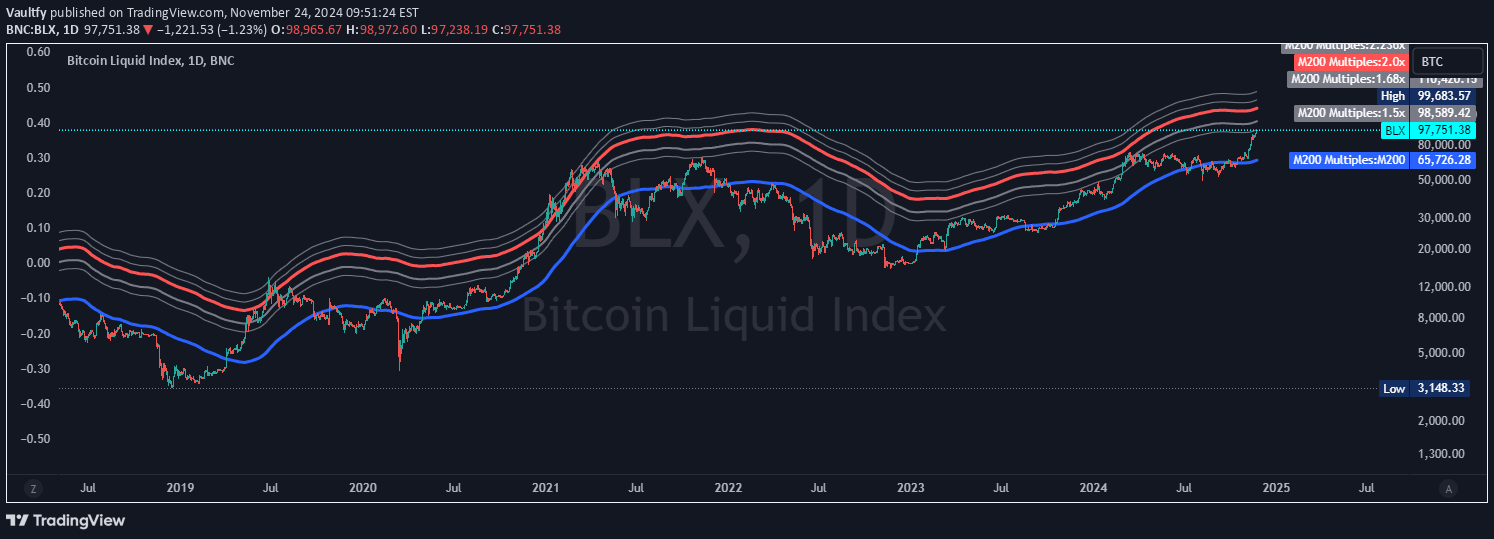
The script calculates a 200-period Simple Moving Average (M200) as the primary trend indicator, representing the long-term price direction. By generating multiple lines based on M200 multipliers like 1.5x, 1.68x, 2x, 2.236x, and 2.5x, traders can visualize potential support and resistance levels dynamically derived from the base moving average.
These multiplied lines create a framework for understanding price behavior, with each multiple offering insights into potential market zones. The blue M200 line serves as the core trend indicator, while the gray multiplier lines help traders identify intermediate price levels and potential turning points in the market.
Why it may be useful
Moving average multipliers provide traders with a systematic approach to understanding market structure beyond traditional price analysis. By using multiple derivatives of a single moving average, traders can develop a more nuanced view of potential support and resistance zones that go beyond standard technical analysis techniques.
This method allows for a more flexible and dynamic interpretation of market trends, helping traders anticipate potential price movements and make more informed trading decisions. The multiple levels create a visual framework that can enhance trend identification and provide additional context for entry and exit strategies.
When to explore it
This strategy works best on daily time frames with assets that demonstrate clear trend characteristics and sufficient price volatility. It is particularly effective in markets with consistent directional movements, where long-term trends are more pronounced and predictable.
Traders should apply this technique in markets like major stock indices, forex pairs, and liquid commodities where long-term trend analysis provides meaningful insights. The approach is most valuable for swing traders and investors seeking to understand broader market dynamics and potential future price levels.
Keep exploring
What we’ve verified
Access, alerts and repainting behaviour have not been independently verified for this indicator. Check the creator’s current publication and settings.
General descriptions and classifications are recovered research. Verified details above identify the specific checks we have completed. Check the creator’s current publication for later changes.