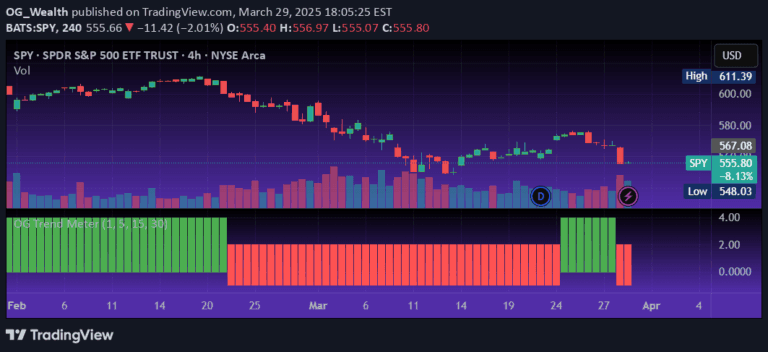
A trading strategy using moving average crossovers to generate buy and sell signals based on the relationship between short-term and long-term moving averages.
Explore complementary indicator rolesHow it works
The moving average cross strategy compares two moving averages with different time periods to generate trading signals. When the short-term moving average crosses above the long-term moving average, it generates a buy signal, indicating potential upward momentum. Conversely, when the short-term moving average crosses below the long-term moving average, it generates a sell signal, suggesting potential downward price movement.
Traders can customize the strategy by selecting different moving average types, time frames, and price sources such as open, close, high, or low prices. The flexibility allows traders to adapt the strategy to various market conditions and trading styles, making it a versatile technical analysis tool.
Why it may be useful
The moving average cross strategy helps traders identify potential trend changes and momentum shifts in financial markets. By comparing short-term and long-term price trends, traders can make more informed decisions about entering or exiting positions. This approach provides a systematic method for filtering market noise and focusing on significant price movements.
Moreover, the strategy offers a visual and quantitative approach to understanding market dynamics. Traders can evaluate potential trading proceedings and losses, which helps in risk management and developing more robust trading strategies. The ability to measure potential risks and returns makes this indicator valuable for both novice and experienced traders.
When to explore it
The moving average cross strategy works best in trending markets with clear directional movements. It is particularly effective in markets that exhibit sustained upward or downward trends, where price momentum is consistent. Traders should use this strategy in liquid markets with sufficient trading volume to ensure reliable signals.
The indicator is most suitable for trading instruments with relatively stable price characteristics, such as major stock indices, large-cap stocks, and certain commodities. It may be less effective in highly volatile or choppy markets where price movements are erratic and lack clear directional trends. Combining this strategy with other technical and fundamental analysis can enhance its reliability and effectiveness.
Keep exploring
What we’ve verified
Access, alerts and repainting behaviour have not been independently verified for this indicator. Check the creator’s current publication and settings.
General descriptions and classifications are recovered research. Verified details above identify the specific checks we have completed. Check the creator’s current publication for later changes.