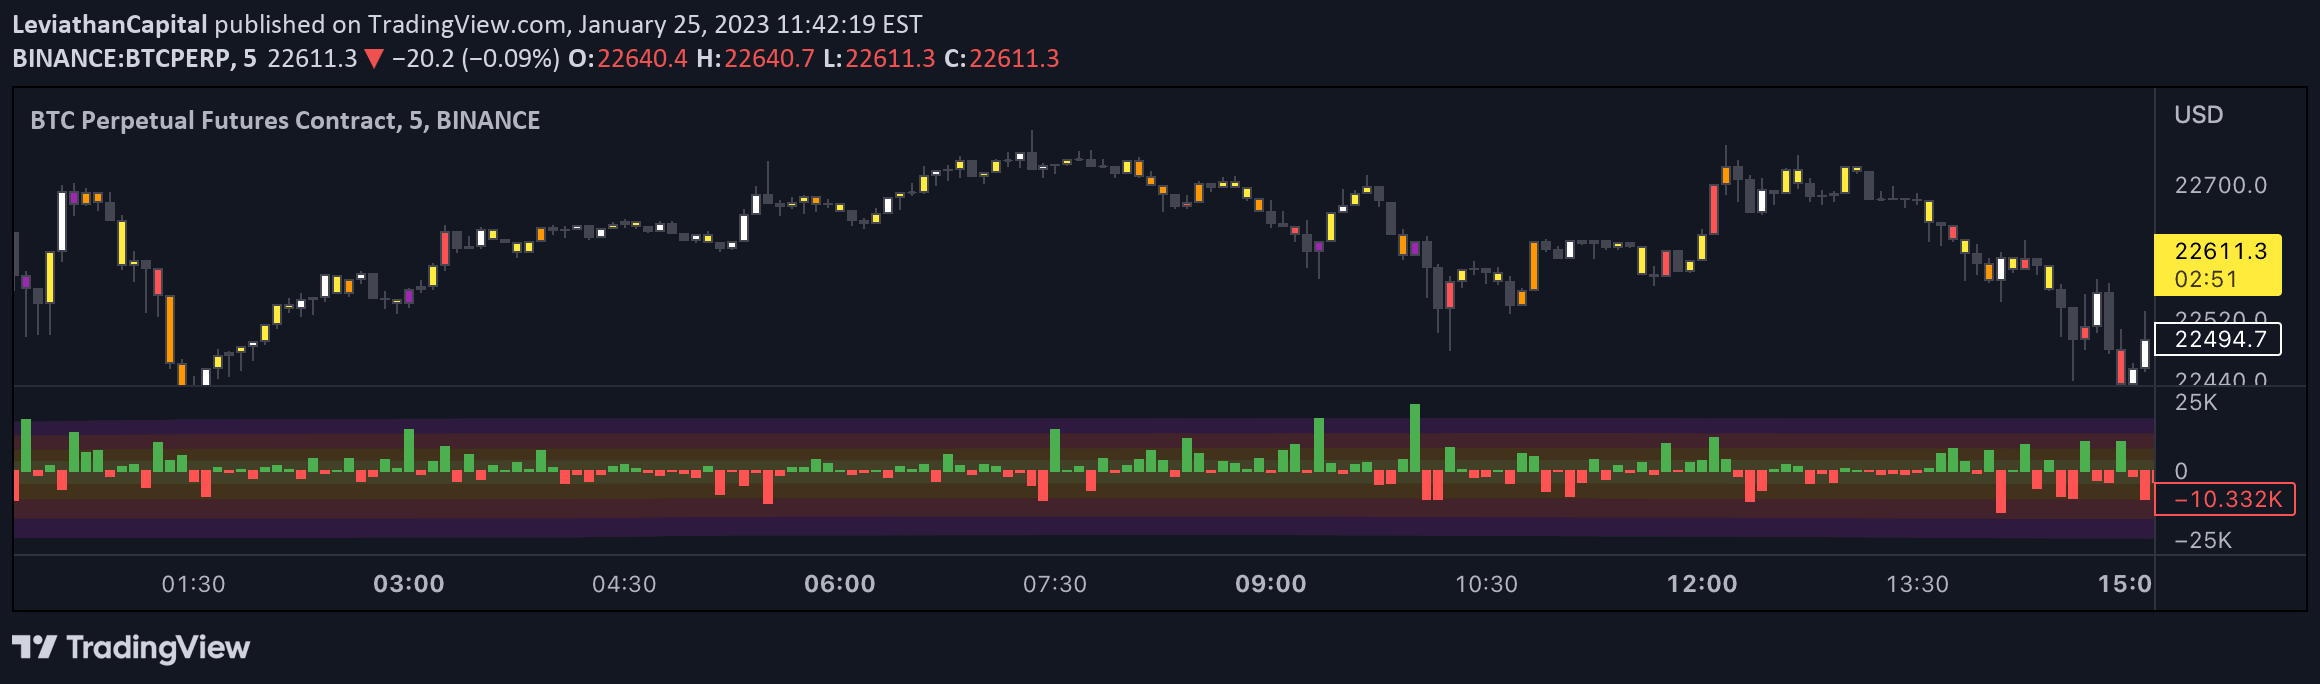
An indicator measuring trading volume from the opposite side of current market price to assess market control and potential trend shifts.
Explore complementary indicator rolesHow it works
The Opposite Side Liquidity Dominance Indicator analyzes historical trading volume by examining the volume on the opposite side of the current market price. It calculates a comparative metric using a specified lookback period, typically 50 days, to determine the current trading volume's strength relative to historical averages.
When the current volume exceeds historical norms, the indicator suggests dominance by traders with a different market perspective. The visual representation includes a color-coded background and a line chart tracking liquidity dominance over time, providing traders with an intuitive way to understand market dynamics.
Why it may be useful
This indicator helps traders understand market sentiment by revealing the trading activity of participants who have a different view from the current price trend. By highlighting potential shifts in market control, it provides insights into possible trend reversals or continuation patterns that might not be immediately apparent from price action alone.
Traders can use this signal to gauge underlying market psychology, identifying moments when opposing market participants are gaining or losing momentum. This additional layer of analysis can help traders make more informed decisions about potential entry and exit points in their trading strategies.
When to explore it
The Opposite Side Liquidity Dominance Indicator is most effective in markets with clear price trends and significant trading volume. It works best in forex, stock, and cryptocurrency markets where liquidity and trading activity are consistently high. Traders should use this indicator in conjunction with other technical and fundamental analysis tools for comprehensive market assessment.
The signal is particularly useful during periods of market uncertainty or potential trend transitions. Traders can leverage this indicator to identify potential breakout points, confirm trend strength, or detect early signs of market sentiment shifts across different timeframes.
Keep exploring
What we’ve verified
Access, alerts and repainting behaviour have not been independently verified for this indicator. Check the creator’s current publication and settings.
General descriptions and classifications are recovered research. Verified details above identify the specific checks we have completed. Check the creator’s current publication for later changes.