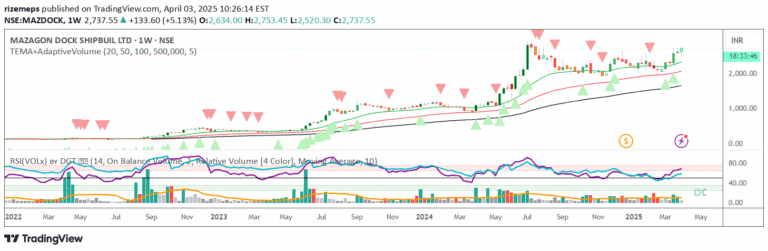
A dynamic trading indicator that combines price action, volume analysis, and trend prediction to forecast potential market movements with confidence bands and volume-based insights.
Explore complementary indicator rolesHow it works
The indicator operates by analyzing the intricate relationship between price movements and trading volume, utilizing Volume-Weighted Average Price (VWAP) and exponential moving averages to determine trend strength and direction. It calculates trend dynamics by weighing volume significance and incorporating momentum indicators to enhance predictive accuracy.
The core algorithm integrates current price metrics, volume characteristics, and trend analysis to project potential future price levels. By generating confidence bands based on price volatility, the indicator creates a visual representation of possible price trajectories, allowing traders to understand potential market movement probabilities.
Why it may be useful
This indicator provides traders with a comprehensive market analysis tool that goes beyond traditional single-metric indicators by simultaneously examining price, volume, and trend dynamics. By offering a multi-dimensional perspective, it helps traders make more informed decisions, reducing the uncertainty inherent in market predictions.
The combination of volume-based insights, trend strength analysis, and predictive confidence bands empowers traders to assess market conditions more holistically. It enables more nuanced risk management by visualizing potential price ranges and providing a deeper understanding of market momentum and potential directional shifts.
When to explore it
The indicator is most effective in markets with clear trending characteristics and consistent volume patterns, where price movements show discernible momentum and directional strength. Traders should prioritize its use during periods of stable market conditions where volume and price correlations are more predictable and reliable.
It becomes particularly valuable when seeking to confirm trend continuations, identify potential reversal points, and manage risk through its confidence band visualization. Optimal application occurs in markets with sufficient liquidity and during timeframes that allow for meaningful volume and price analysis.
Keep exploring
What we’ve verified
Access, alerts and repainting behaviour have not been independently verified for this indicator. Check the creator’s current publication and settings.
General descriptions and classifications are recovered research. Verified details above identify the specific checks we have completed. Check the creator’s current publication for later changes.