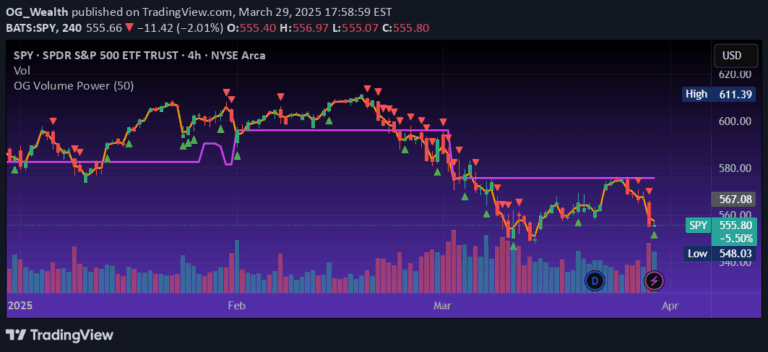
A volume indicator that visually represents trading volume efficiency by adjusting color intensity based on price movement and volume, revealing market dynamics and potential trend strength.
Explore complementary indicator rolesHow it works
The indicator calculates volume efficiency by comparing the candle's price movement to its trading volume. It determines the efficiency ratio by dividing the absolute price change by the total volume traded during that period. This calculation allows the indicator to dynamically assess how much price movement occurred relative to the volume expended.
Each candle's volume bar is then colored and shaded based on this efficiency metric. Bullish candles are colored green, bearish candles are red, with color intensity reflecting the movement's efficiency. Highly efficient movements with significant price change and low volume will display stronger, more intense colors, while less efficient movements with high volume and minimal price change will appear pale and washed out.
Why it may be useful
This volume efficiency indicator provides traders with a nuanced view of market dynamics that goes beyond traditional volume analysis. By visualizing the relationship between price movement and trading volume, it helps traders understand the underlying strength or weakness of a market trend. The color-coded display makes it easier to quickly identify potentially significant price movements with low resistance.
The indicator's ability to show market efficiency can help traders distinguish between genuine trend movements and periods of market indecision or absorption. This can be particularly valuable in identifying potential trend reversals, confirming existing trends, and making more informed trading decisions based on the quality of price movement.
When to explore it
The volume efficiency indicator is most effective in markets with clear trending characteristics, such as stocks, forex, and futures markets. It works best during periods of active trading with sufficient volume, where price movements can be meaningfully analyzed. Traders should pay special attention to instances where the color intensity changes dramatically, as these might signal important shifts in market sentiment.
The indicator is particularly useful for short-term trading strategies like scalping and day trading, where quick interpretation of market dynamics is crucial. Traders can use it to confirm entry and exit points, assess the strength of price movements, and identify potential momentum shifts. However, it should be used in conjunction with other technical analysis tools to provide a comprehensive market analysis.
Keep exploring
What we’ve verified
Access, alerts and repainting behaviour have not been independently verified for this indicator. Check the creator’s current publication and settings.
General descriptions and classifications are recovered research. Verified details above identify the specific checks we have completed. Check the creator’s current publication for later changes.