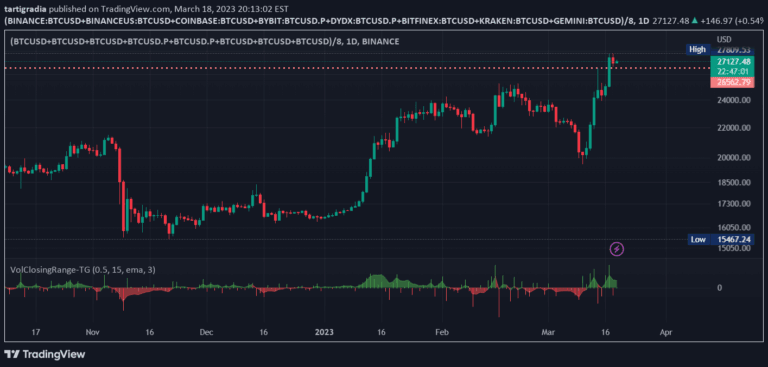
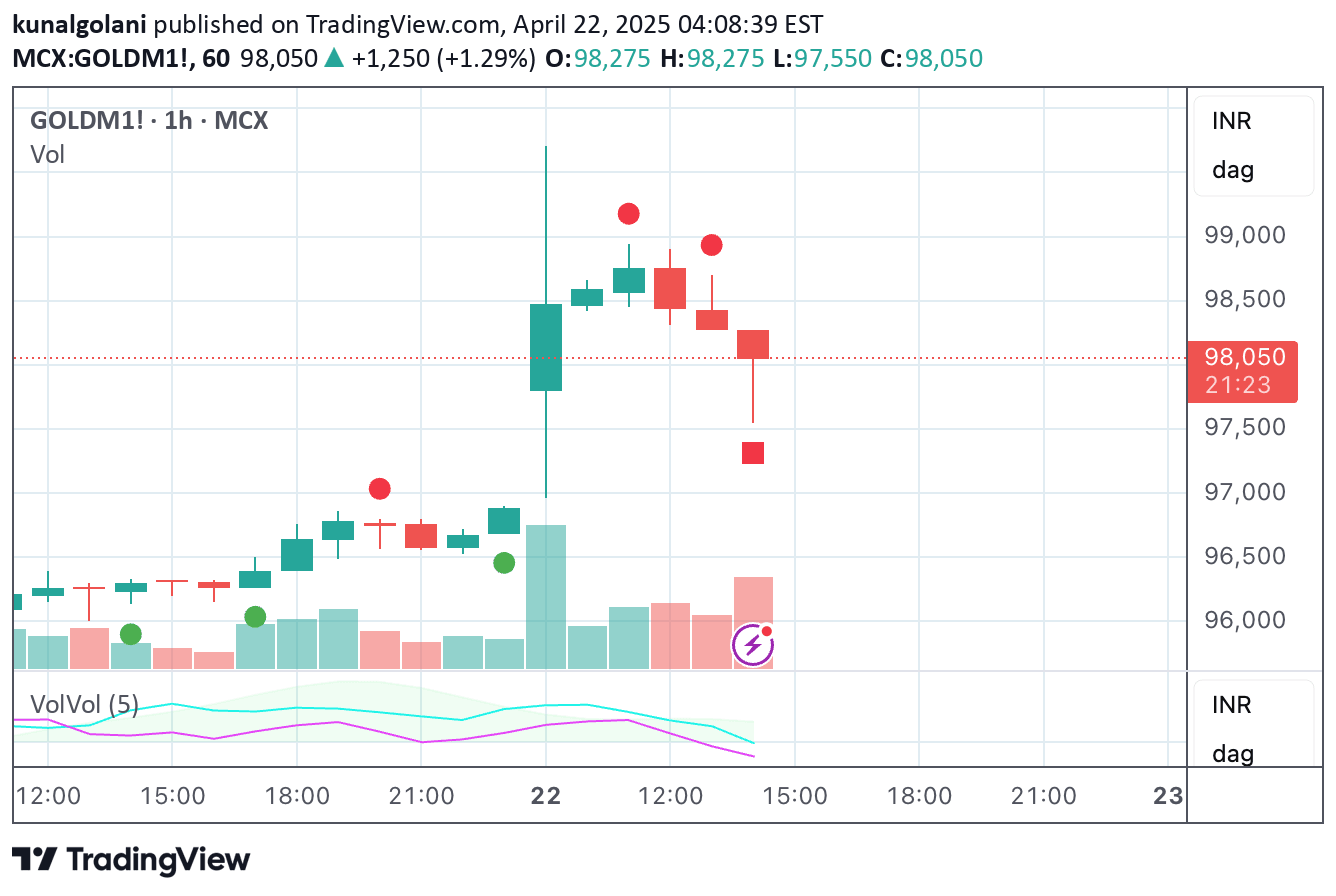
A Pine Script indicator integrating Volume Spread Analysis with impulse signals and forecast boxes to help traders identify potential market movements and trading opportunities.
Explore complementary indicator rolesHow it works
The VSA Impulse indicator analyzes price and volume relationships to generate trading signals. It identifies impulse movements by comparing current bar's price and volume to the previous bar, detecting specific VSA signals like Stopping Action, Spring, and Jump Over Creek.
The script uses a sophisticated algorithm to detect anomalous volume spikes and create forecast boxes for potential market movements. It calculates average volume over a specified length and applies a multiplier to highlight significant volume changes, providing visual cues through colored boxes and labels.
Why it may be useful
Volume Spread Analysis provides traders with deeper insights into market dynamics beyond simple price movement. By integrating volume analysis with impulse signals, traders can better understand underlying market sentiment and potential trend reversals.
The indicator's ability to detect complex volume patterns helps traders identify hidden market information that might not be apparent from price action alone. This approach allows for more informed trading decisions by revealing professional trader activity and potential market turning points.
When to explore it
This indicator is most effective in markets with clear volume trends and significant price movements. It works best in liquid markets like major forex pairs, stock indices, and high-volume commodities where volume data provides meaningful insights.
Traders should use this signal during periods of market volatility, such as during economic news releases, earnings reports, or significant market events. It is particularly useful for identifying potential trend reversals and confirming existing market momentum through sophisticated volume analysis.
Keep exploring
What we’ve verified
Access, alerts and repainting behaviour have not been independently verified for this indicator. Check the creator’s current publication and settings.
General descriptions and classifications are recovered research. Verified details above identify the specific checks we have completed. Check the creator’s current publication for later changes.